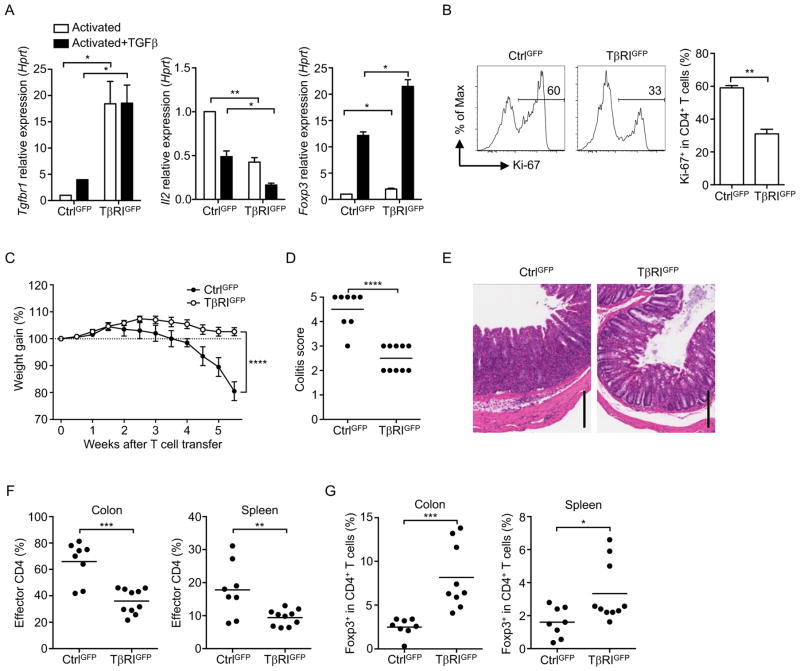
Figure 5. TβRI Overexpression in naïve T cells suppresses T cell proliferation and autoimmunity.
(A) Tgfbr1, Il2 and Foxp3 mRNA in naïve TβRIGFP+ or CtrlGFP+ CD4+ T cells stimulated for 24 hr with anti-CD3 and anti-CD28 in the presence or absence of TGFβ. (B) Frequency of Ki-67+ in naïve TβRIGFP+ or CtrlGFP+ CD4+ T cells stimulated for 3 days with anti-CD3 and anti-CD28 plus TGFβ. (C–G) Naïve CD4+ T cells from TβRIGFP+ or CtrlGFP+ retrogenic mice were transferred into Rag1−/− mice. (C) Weight gain of recipient mice after T cell transfer. (D) Quantitation of colon pathology. (E) Representative histology images of colon sections. Scale bars, 200 μm. (F) Frequencies of the donor TβRIGFP+ or CtrlGFP+ CD4+ T cells in recipient mice. (G) Frequencies of Foxp3+ cells in the donor CD4+ T cell population. Data are pooled from two (A, B) or three (C–G) independent experiments. In (D, F, G), each circle represents the data from one mouse. In (A, B, D, F, G), Student’s t-test was used. In (C), two-way ANOVA was used; bars (mean), error bars (SD in A, B; SEM in C), *P < 0.05, **P < 0.01, ***P < 0.001 and ****P < 0.0001. See also Figure S5 and S6.

