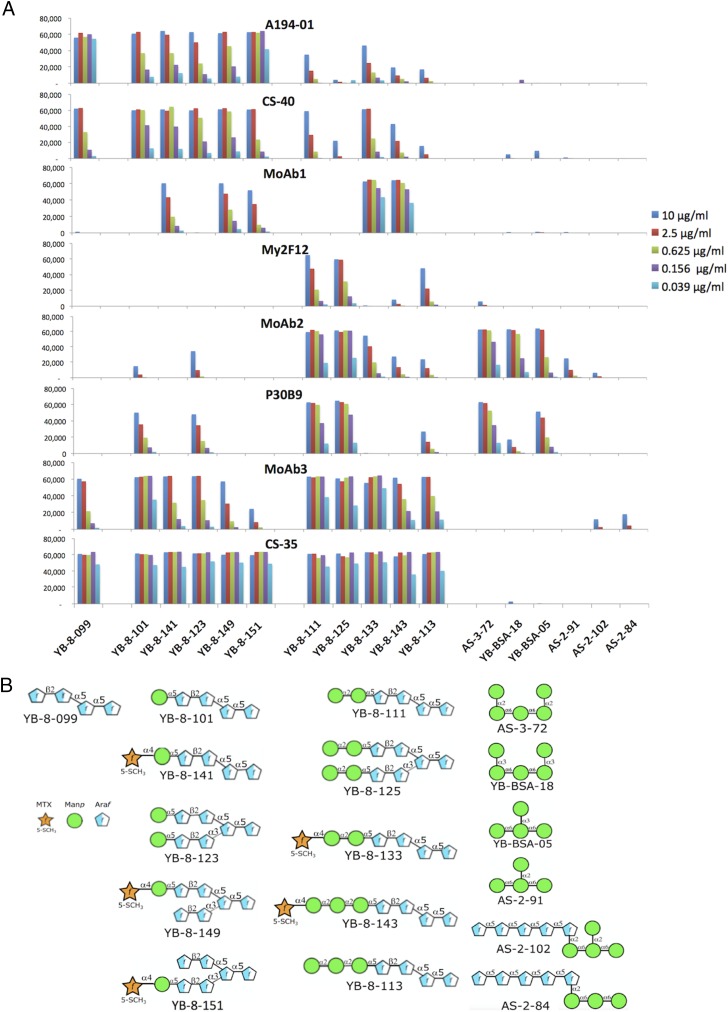
FIGURE 3.
Results of a microarray analysis of the epitope specificities of mAbs dependent on mannose-capping against a subset of mannose-capped and polymannose glycan Ags shown in (B). (A) Relative Ab affinities were titrated by testing each Ab at the five concentrations indicated against the microarray, and the fluorescent signal intensities are plotted. The complete panel of structures represented in glycan microarray of microbial carbohydrates is shown in Supplemental Fig. 2, and the complete reactivity pattern is shown in Supplemental Fig. 3.

