
Figure 1. Lysosomal damage inhibits mTOR signaling.
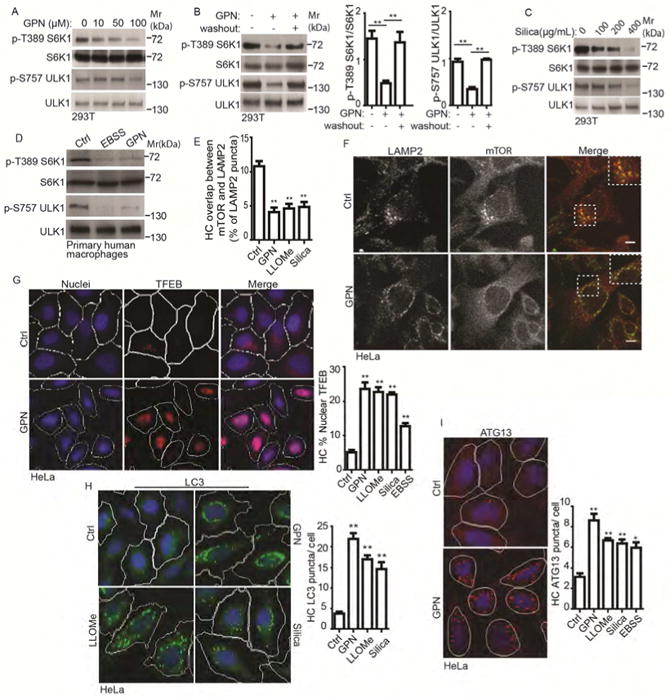
(A) Dose-response mTOR activity (pS6K1 (T389) and pULK1 (S757)), to lysosomal damage by GPN (full medium, 1 h). (B) As in A after 1h washout in full medium. (C) As in A, dose-response to silica in full medium, 1 h. (D) mTOR activity in primary human macrophages treated with 100 μM GPN in full medium or starved in EBSS for 1 h (Ctrl, full medium only). (E) Quantification by automated high-content imaging and analysis (HC) of overlaps between mTOR and LAMP2 (images, Figure S1D); cells treated with 100 μM GPN, 2mM LLOMe, or 400 μg/mL Silica for 1 h in full medium. (F) Immunofluorescence confocal microscopy of mTOR localization relative to LAMP2-positive lysosomes. 100 μM GPN in full medium, 1 h; endogenous LAMP2 (green florescence, Alexa-488) and mTOR (red florescence, Alexa-568). Scale bar, 5 μm. (G) TFEB nuclear translocation; (treatments: 100 μM GPN, 2mM LLOMe, or 400 μg/mL Silica in full medium 1 h. HC (blue: nuclei, Hoechst 33342; red: anti-TFEB antibody, Alexa-568). White masks, computer algorithm-defined cell boundaries (primary objects); pink masks, computer-identified nuclear TFEB based on the average intensity of Alexa-568 fluorescence. (H) Endogenous LC3 puncta quantified by HC. Tretments as in G. Green masks, computer-identified LC3 puncta (target objects). (I) Endogenous ATG13 puncta quantification by HC; treatments as in G. Red masks, computer-identified ATG13 puncta (target objects). Data, means □ SEM; immunoblots: n ≥ 3; HC: n ≥ 3 (each experiment: 500 valid primary objects/cells per well, ≥ 5 wells/sample). *p < 0.05, **p < 0.01, ANOVA. See also Figure S1.