
Figure 2. Ragulator-Rag complex responds to lysosomal damage in control of mTOR.
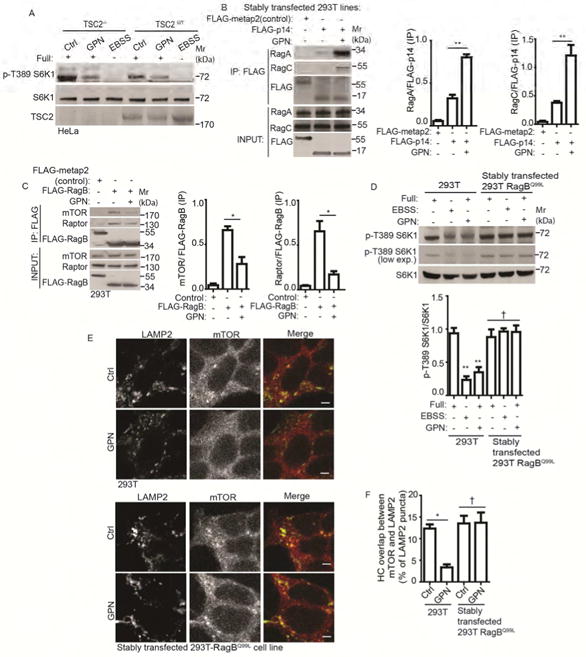
(A) mTOR activity (immunoblot analysis of S6K1 (T389) phosphorylation) in TSC2-deleted (TSC2-/-) and wild type (TSC2WT) cells treated with 100 μM GPN in full medium (Full) or starved in EBSS for 1 h. Ctrl (control): untreated cells. (B) Co-immunoprecipitation analysis of changes in interactions between Ragulator and Rag GTPases following treatment with GPN. HEK293T cells stably expressing FLAG-metap2 (control) or FLAG-p14 were treated with 100 μM GPN in full medium for 1 h. Cell lysates were immunoprecipitated (IP) with anti-FLAG antibody and immunoblotted for endogenous RagA or RagC. (C) Immunoprecipitation (IP) analysis of interactions between RagB and mTOR/Raptor in cells treated with GPN. HEK293T cells overexpressing FLAG-metap2 (control) or FLAG-RagB were treated with 100 μM GPN in full medium for 1 h. Cell lysates were IP-ed with anti-FLAG antibody and immunoblotted for endogenous mTOR or Raptor. (D) mTOR activity in HEK293T cells or HEK293T cells stably expressing constitutively active RagB GTPase (RagBQ99L) treated and analyzed as in A. (E) Immunofluorescence confocal microscopy visualization of mTOR localization relative to LAMP2-positive lysosomes. Cells as in D were treated as in A, and immunostained for endogenous LAMP2 (green florescence, Alexa-488) and mTOR (red florescence, Alexa-568). Scale bar, 1 μm. (F) Quantification by HC of overlaps between mTOR and LAMP2 (images, Figure S2C) in cells as in D, treated as in A. Data, means □ SEM; immunoblots: n ≥ 3; HC: n ≥ 3 (each experiment: 500 valid primary objects/cells per well, ≥ 5 wells/sample). † p ≥ 0.05 (not significant), *p < 0.05, **p < 0.01, ANOVA. See also Figure S2.