
Figure 4. Gal8 is required for mTOR inactivation in response to lysosomal damage.
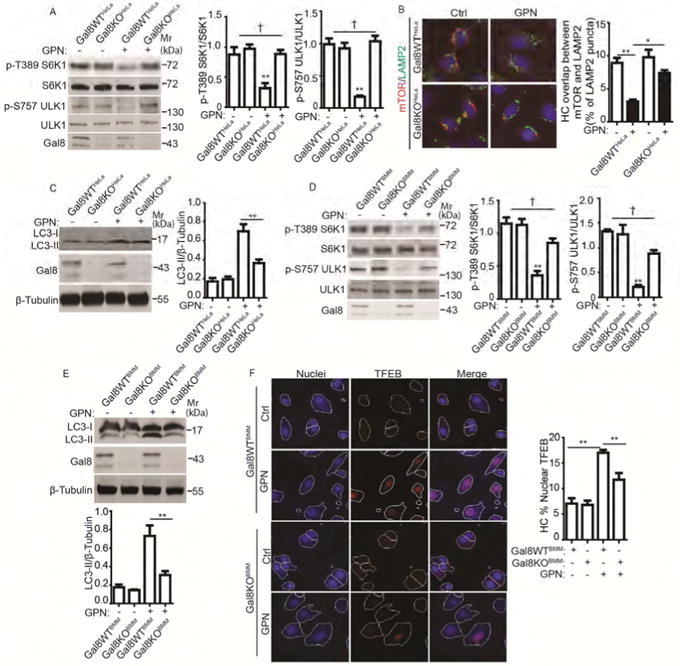
(A) mTOR activity, monitored by phosphorylation of S6K1 (p-T389) and ULK1 (S757), in parental (Gal8WTHeLa) and Gal8-knockout (Gal8KOHeLa) HeLa cells treated with 100 μM GPN in full medium for 1 h. (B) HC analysis of overlaps between mTOR and LAMP2 in Gal8WTHeLa and Gal8KOHeLa cells treated as in A. Ctrl (control): untreated cells. Red and green masks, computer-identified mTOR and LAMP2, respectively (target objects). (C) Immunoblotting analysis of LC3 lipidation (LC3-II) in Gal8WT eLa and Gal8KOHeLa treated as in A. (D) mTOR activity (monitored as in A) in bone marrow-derived macrophages (BMMs). BMMs of wild type C57BL (Gal8WTBMM) and their littermate Gal8-knockout mice (Gal8KOBMM) were treated with 400 μM GPN in full medium for 1 h. (E) Analysis of autophagy induction (monitored as in C) in Gal8WTBMM and Gal8KOBMM treated with 400 μM GPN in full medium for 1 h. (F) HC analysis of TFEB nuclear translocation in Gal8WTBMM and Gal8KOBMM treated with 400 μM GPN in full medium for 1 h. Nuclei: blue pseudocolor, Hoechst 33342; TFEB: red fluorescence, Alexa-568. Ctrl (control): untreated cells. White masks, algorithm-defined cell boundaries (primary objects); pink masks, computer-identified nuclear TFEB based on average intensity. Data, means □ SEM; blots: n ≥ 3, HC: n ≥ 3 (each experiment: 500 valid primary objects/cells per well, ≥ 5 wells/sample). † p ≥ 0.05 (not significant), *p < 0.05, **p < 0.01, ANOVA. See also Figure S4.