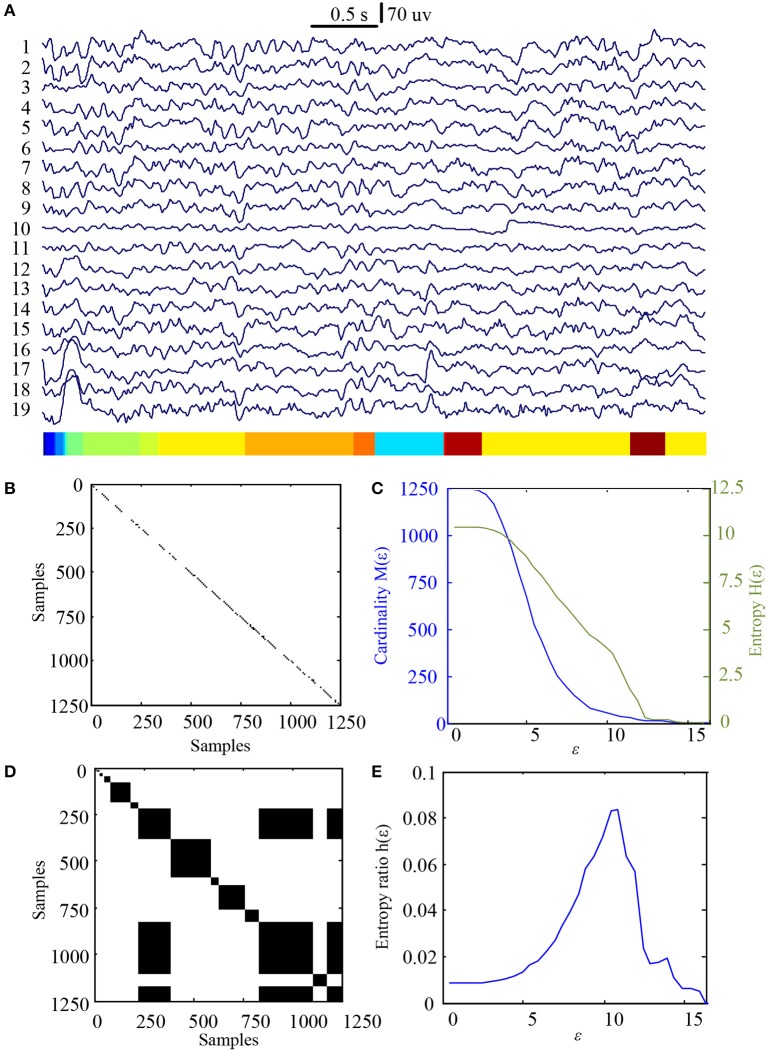
Figure 3.
MER analysis of an EEG segment of post-stimulation. (A) The original EEG data from the post-tDCS state; (B) The recurrence plot of (A), with ε = 10.88; (C) Change of entropy and cardinality with ε; (D) Symbolic recurrence plot; (E) Change of entropy ratio with ε (from 0.01 – 16.46 with 0.01 increment).

