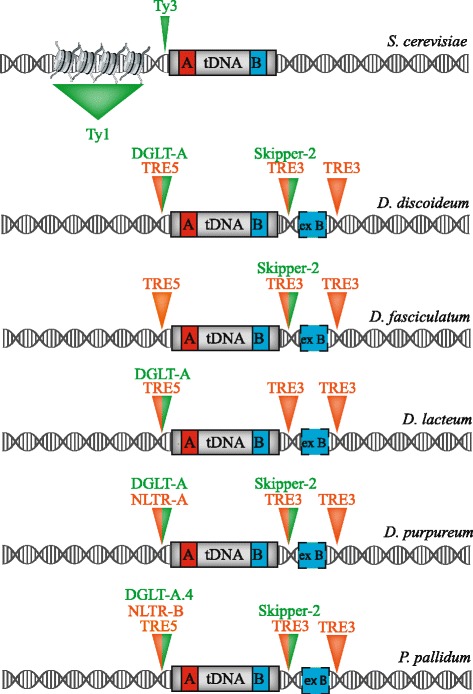
Fig. 3.

tRNA targeted retrotransposon insertion site profiles. The insertion site preference for S. cerevisiae, Dictyostelium and P. pallidum are shown here upstream and downstream of a tRNA gene. The tRNA gene (gray) contains box A (red) and box B (blue) internal promoters and the external box B (ex B, blue) for social amoeba. LTR-retrotransposons are in green and non-LTR retrotransposons are in orange. Inverted orange or green triangles denote retrotransposon insertion windows ranging from 2 to ~ 1000 bp upstream or 7 to ~ 450 bp downstream of the tRNA gene (not drawn to scale). For the social amoeba, split orange and green inverted triangles denote overlapping insertion footprints for LTR (DGLT-A, Skipper-2) and non-LTR (NLTR-A, NLTR-B, TRE5, TRE3) retrotransposons. For P. pallidum, a specific DLGT-A (DGLT-A.4) is indicated because DGLT-A.1–3 do not target to tRNA genes in this organism [124]. The green triangle with a broader base represents the larger insertion window for S. cerevisiae Ty1 which can insert up to ~ 1 kb upstream of a Pol III-transcribed gene. Nucleosomes are depicted upstream of the S. cerevisiae tRNA gene as Ty1 inserts into nucleosomes
