
Figure 4.
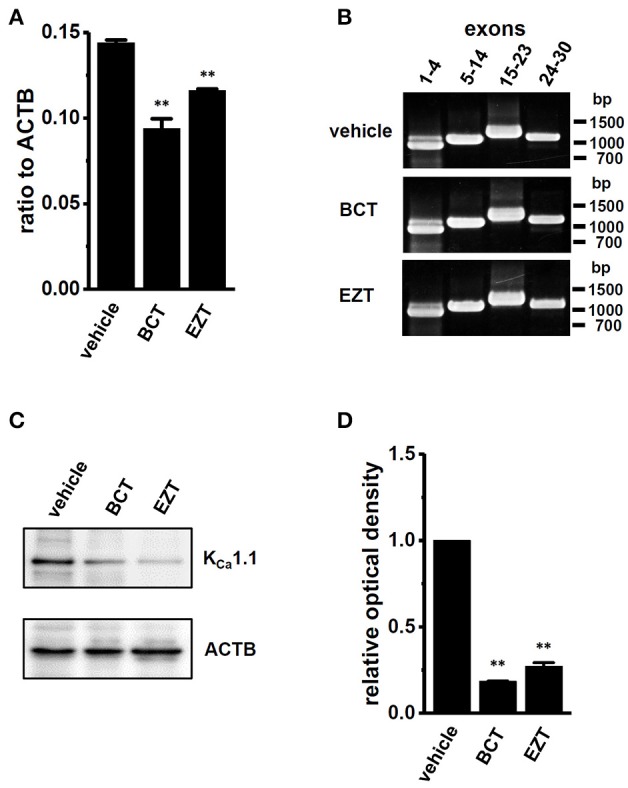
Down-regulation of KCa1.1 transcripts and proteins in MDA-MB-453 cells by treatments with antiandrogens for 48 h. (A) Real-time PCR assay for KCa1.1 in vehicle-, 1 μM BCT-, and 1 μM EZT-treated MDA-MB-453 cells (n = 4 for each). Expression levels were expressed as a ratio to ACTB. (B) Band patterns on agarose gels for the PCR products of KCa1.1 exons (exons 1–4, 5–14, 15–23, and 24–30) in vehicle-, 1 μM BCT-, and 1 μM EZT-treated MDA-MB-453 cells. A DNA molecular weight marker is indicated on the right of the gel. (C) Protein lysates of vehicle-, 1 μM BCT-, and 1 μM EZT-treated MDA-MB-453 cells were probed by immunoblotting with anti-KCa1.1 (upper panel) and anti-ACTB (lower panel) antibodies on the same filter. (D) Summarized results were obtained as the optical density of KCa1.1 and ACTB band signals. After compensation for the optical density of the KCa1.1 protein band signal with that of the ACTB signal, the KCa1.1 signal in the vehicle control was expressed as 1.0 (n = 3 for each). Results are expressed as means ± SEM. **p <0.01 vs. the vehicle control.