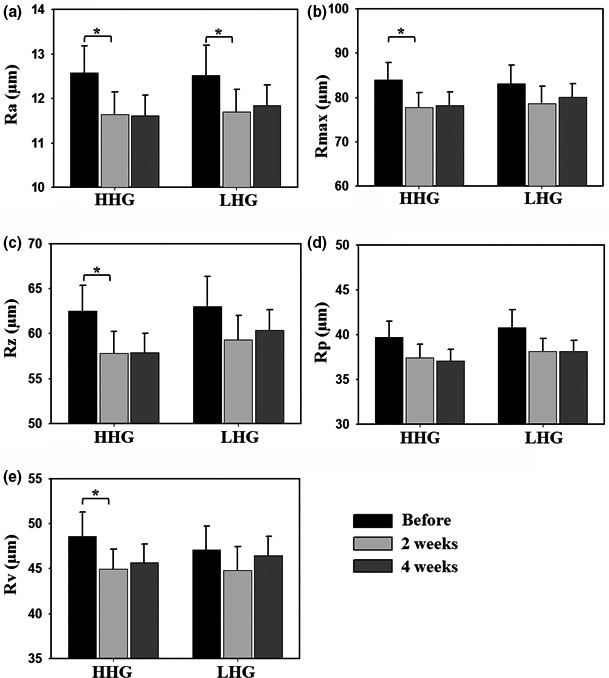
Figure 2.

Changes in skin roughness following cosmetic use in facial cheek skin of the high hydration group (HHG) and low hydration group (LHG). Skin roughness parameters: R a, arithmetic mean roughness (a); R max, maximum roughness (b); R z, mean depth roughness (c); R p, maximum profile peak height (d); R v, maximum profile valley depth (e). Data in bar graphs are presented as means ± standard error, and the significance of differences is indicated by *p < .05
