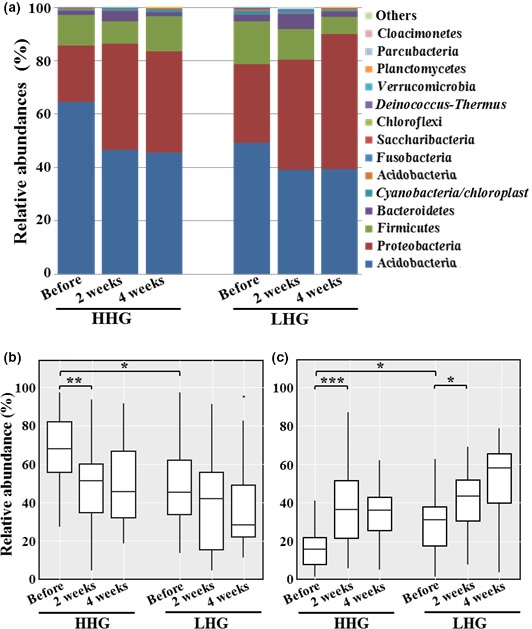
Figure 5.

Mean abundances at the phylum level in facial cheek skin of high hydration group (HHG) and low hydration group (LHG) (a) and statistical box‐plot analysis for the relative abundance of Actinobacteria (b) and Proteobacteria (c). The mean abundances were the mean value of the relative abundance of each phylum in the sampling groups. Significant differences are indicated by *p < .05; **p < .01; and ***p < .001
