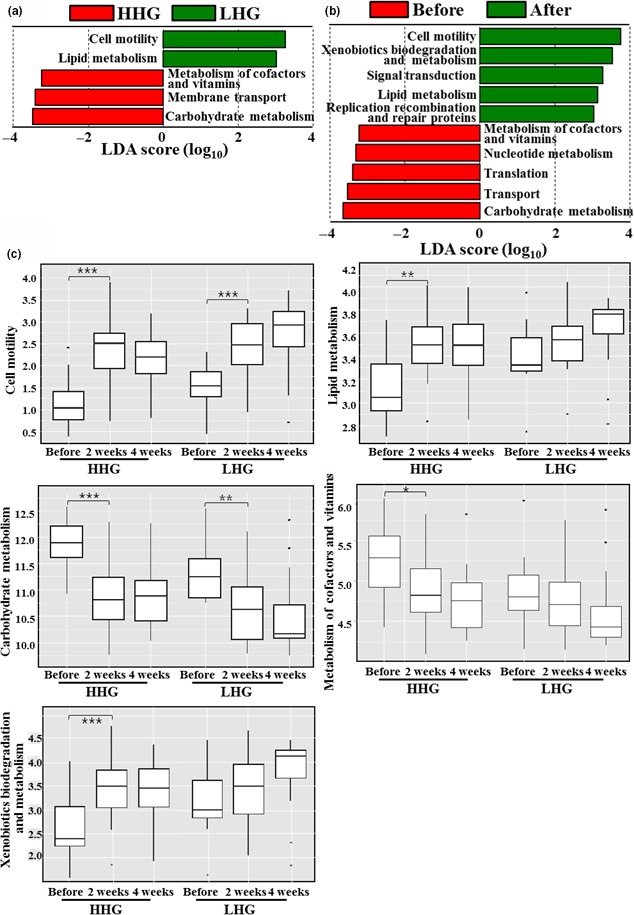
Figure 8.

Linear discriminant analysis effect size (LEfSe) analysis of KEGG pathways with differential abundance between the high hydration group (HHG) and low hydration group (LHG) before cosmetic use (a) and comparing pathway abundance before and after cosmetic use regardless of HHG and LHG (b). Significance levels for LEfSe were p < .05, and only KEGG pathways with linear discriminant analysis (LDA) score >3 are displayed. Additional box‐plot analysis was performed for the representative KEGG pathways showing differential abundance to investigate the abundance change in KEGG pathways in response to cosmetic use in each hydration group (c). Significant differences are indicated by *p < .05; **p < .01; and ***p < 0.001
