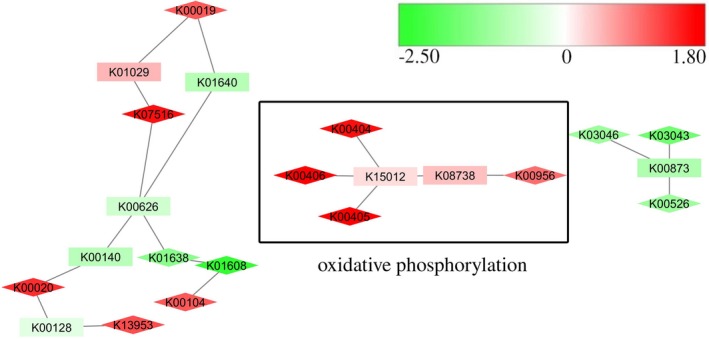
Figure 6.

Molecular pathways differentially expressed between consortium and monoculture conditions for WDL7 as inferred by PheNetic. Log2‐fold change in expression is indicated on a color scale from green to red, with red signifying underexpression in consortium conditions and green representing overexpression in consortium conditions. Genes that are differentially expressed (|Log2‐fold change| ≥ 1) are indicated by diamond shapes. Discussed pathways are boxed and annotated
