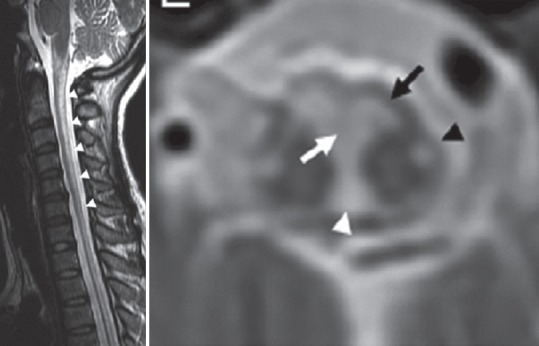
Figure 2.

T2-weighted magnetic resonance imaging of the spine in a leukoencephalopathy, brain stem and spinal cord involvement and lactic acidosis patient showing hyperintensities of the dorsal column (sagittal section) and hypointensities of the anterior and posterior spinocerebellar tracts (black arrow and black arrowhead), nuclei and fasciculi gracilis (white arrowhead), and the pyramidal decussation (white arrow) [reproduced with permission from Lan et al., J Neurol Sci 2017])[33]
