Figure 1.

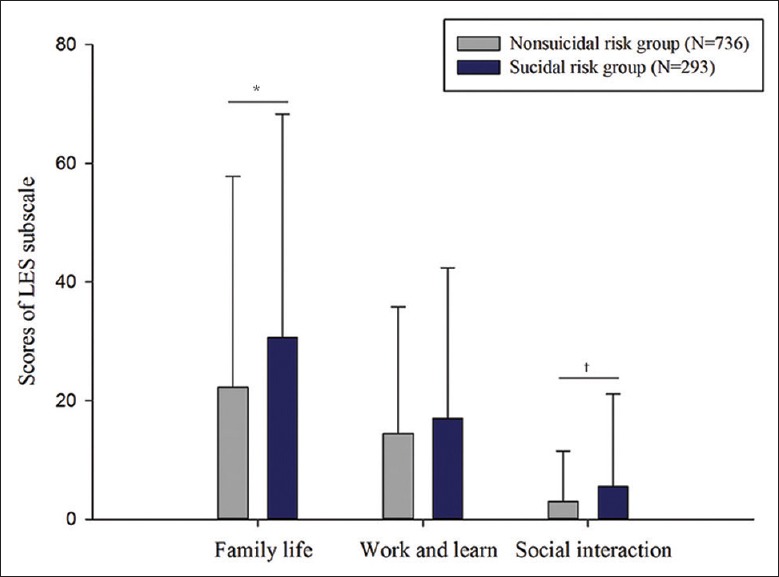
Subscales of SLEs in two groups. *P < 0.001, †P=0.002, nonsuicidal risk group compared with suicidal risk group. SLEs: Stressful life events; LES: Life Events Scale.

Subscales of SLEs in two groups. *P < 0.001, †P=0.002, nonsuicidal risk group compared with suicidal risk group. SLEs: Stressful life events; LES: Life Events Scale.