Figure 1.

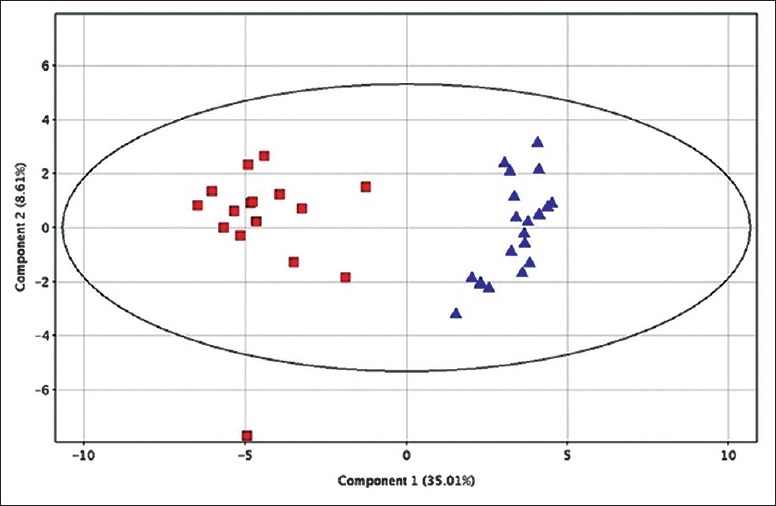
A PCA score plot based on differentially expressed compounds (red squares represent the control group and blue triangles represent the PCOS group). PCA: Principal component analysis; PCOS: Polycystic ovary syndrome.

A PCA score plot based on differentially expressed compounds (red squares represent the control group and blue triangles represent the PCOS group). PCA: Principal component analysis; PCOS: Polycystic ovary syndrome.