. 2018 Apr 19;5(1):174–203. doi: 10.1093/jlb/lsy005
© The Author 2018. Published by Oxford University Press on behalf of Duke University School of Law, Harvard Law School, Oxford University Press, and Stanford Law School.
This is an Open Access article distributed under the terms of the Creative Commons Attribution-NonCommercial-NoDerivs licence (http://creativecommons.org/licenses/by-nc-nd/4.0/), which permits non-commercial reproduction and distribution of the work, in any medium, provided the original work is not altered or transformed in any way, and that the work is properly cited. For commercial re-use, please contact journals.permissions@oup.com
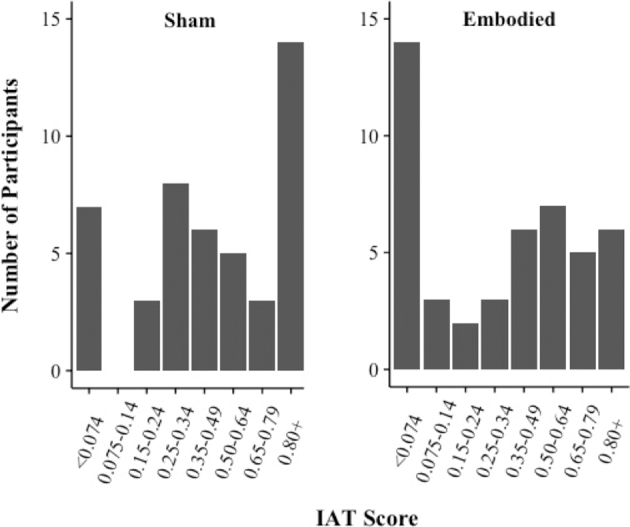
Figure 3.

Distribution of race IAT scores among participants in Sham and Embodied groups.
