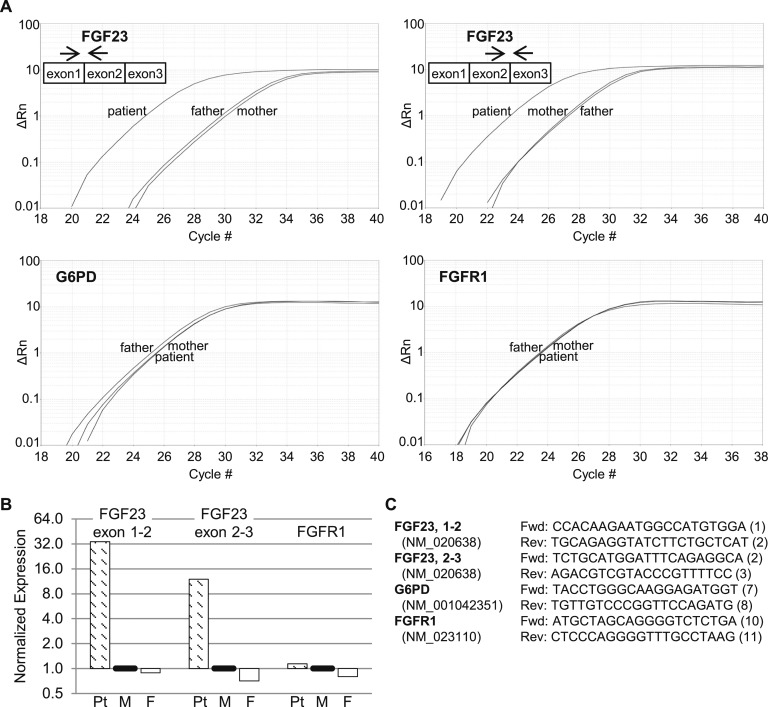
Figure 2.
Isolated white blood cells from the patient demonstrate increased expression of FGF23 mRNA compared with both parents. (A) Gene expression was measured by real-time RT-PCR in samples collected on hospital day 27. The y-axes of the amplification plots (ΔRn) represent fluorescence of the reporter signal normalized to that of the passive reference dye, minus the baseline, and the x-axes represent PCR cycle number. The locations of FGF23 primers are shown schematically in each panel. (B) Relative levels of the FGF23 and FGFR1 amplicons in the patient (Pt), mother (M), and father (F), normalized to glucose-6-phosphate dehydrogenase (G6PD) and relative to the mother (defined as 1). (C) Forward (Fwd) and reverse (Rev) primers for each gene, with the targeted exon shown in parentheses after the sequence.

