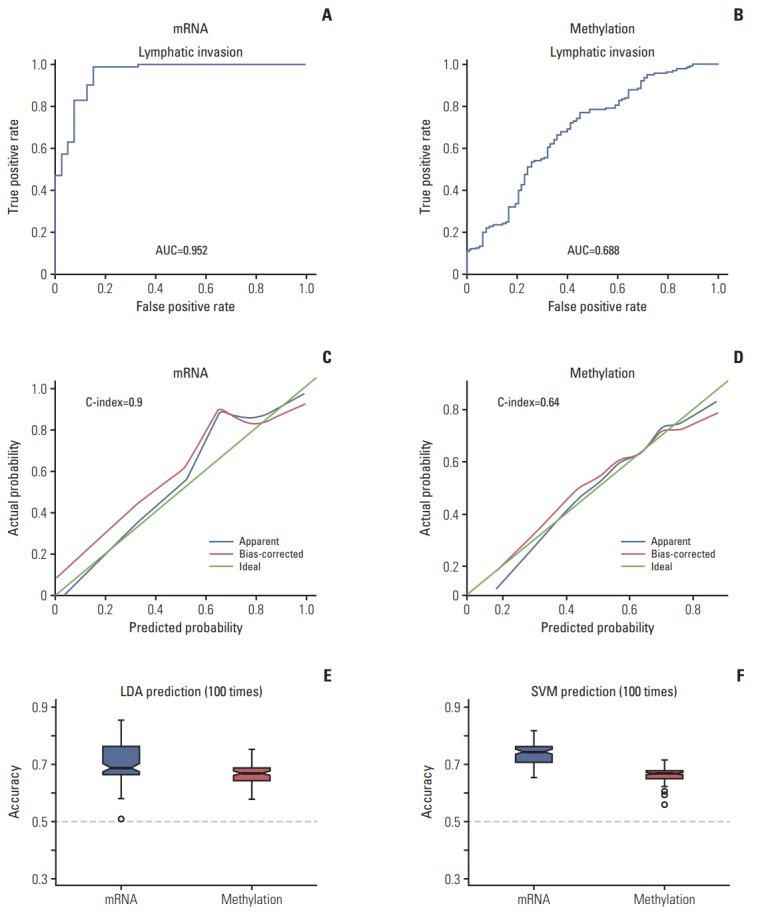
Fig. 3.

Accuracy of predicting lymphatic invasion. (A, B) Receiver operating characteristic curve of the prediction of lymphatic invasion using molecular signatures. (C, D) Logistic regression with C-index. (E) Linear discrimination analysis (LDA). (F) Supporter vector machine (SVM). The Y-axis represents the accuracy of the C-index. AUC, area under the curve.
