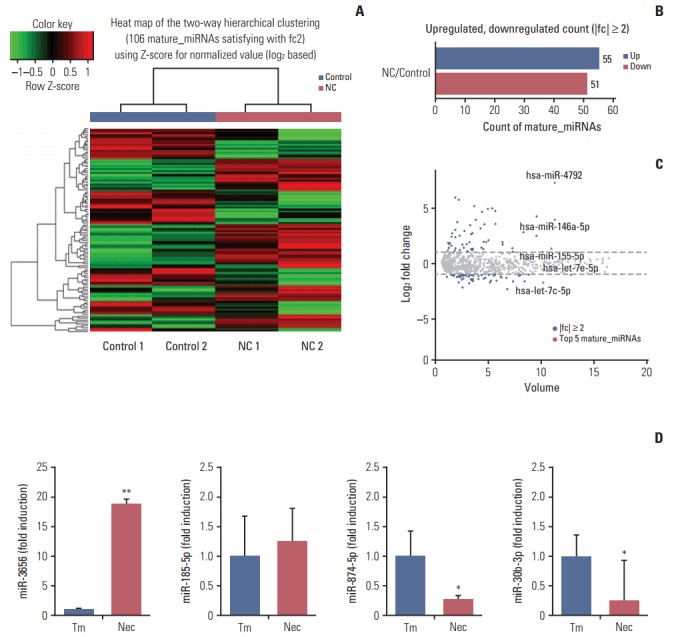
Fig. 1.

Graphical representation of the 106 miRNAs differentially expressed between necrotic cell-treated and untreated CRT-MG cells. (A) Clustering of the 106 most differentially upregulated and downregulated miRNAs for classification between the necrotic cell–treated (NC) and untreated CRT-MG cells (control). Complete linkage hierarchical clustering was performed with the Euclidian distance measure. The NC and control cells clustered separately. The colors in the heat map represent the normalized expression values, with lower expression values being colored in shades of green and higher expression values in shades of red. (B) Counts of mature miRNAs upregulated or downregulated in NC cells. (C) Scatter plot showing the normalized miRNA volume of all conditions analyzed (y-axis) and changes in miRNAs expression between the NC and control cells. The top five most significantly dysregulated miRNAs are marked. (D) Quantitative real-time polymerase chain reaction analysis was performed glioblastoma multiforme tissues from the near-necrosis tumor area (Nec) and from non-necrosis tumor area (Tm). Data are presented as fold induction compared with non-necrosis tumor area. *p < 0.05, **p < 0.01 vs. Tm.
