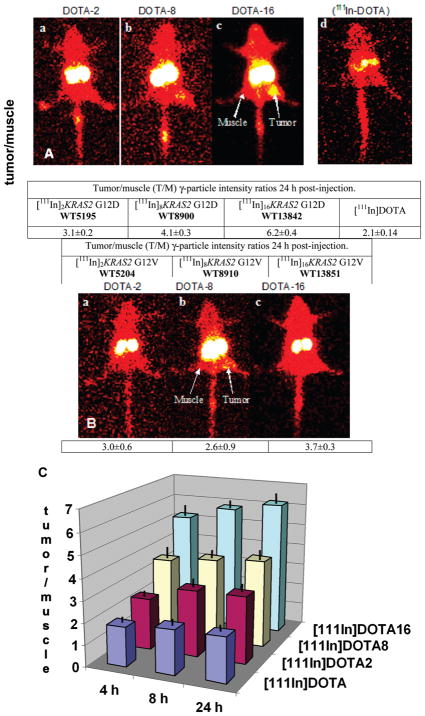
Figure 2.
Scintigraphic images of immunocompromised mice bearing human AsPC1 pancreatic cancer xenografts at 24 h after tail vein administration of ~2 nmol (300–350 μCi, 11–13 MBq) of [111In]nKRAS2 probes to groups of 3 mice. (A) Fully matched G12D probe images (a) [111In]2KRAS2 G12D, WT5195; (b) [111In]8KRAS2 G12D, WT8900; (c) [111In]16KRAS2 G12D, WT13842; (d) 80 nmol [111In]DOTA (~11 MBq, ~300 μCi) control. Tumor/Muscle (T/M) γ-particle intensity ratios were calculated for each group of 3 mice. Holm-Sidak all pairwise multiple comparison revealed that each group was statistically significantly different from the others (p ≤ 0.05). (B) Single mismatch G12 V probes images (a) [111In]2KRAS2 G12 V, WT5204; (b) [111In]8KRAS2 G12 V, WT8910; (c) [111In]16KRAS2 G12 V, WT13851. Kruskal–Wallis one-way analysis of variance on ranks indicated that the three treatment groups were indistinguishable from each other. (C) Histograms of tumor/muscle (T/M) γ-particle intensity ratios of G12D fully matched probes calculated from scintigraphic image intensities. Solid black lines show standard deviations. Each group was statistically significantly different from the other three (p ≤ 0.05).

