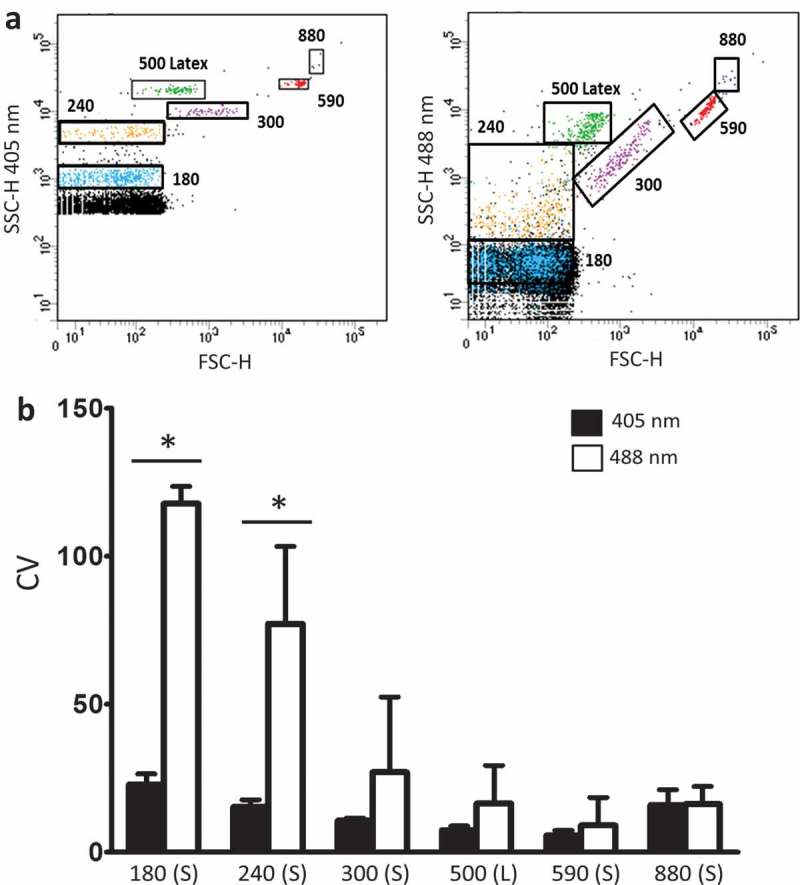
Figure 3.

Improved empiric flow cytometric resolution of microspheres by 405 nm instead of 488 nm side scatter. (a) Depicts populations of 180, 240, 300, 590 and 880 nm silica (S) or 500 nm latex (L) beads resolved by 405 nm (left panel) or 488 nm (right panel) forward scatter (FSC; X axis) and side scatter (SSC; Y axis) by flow cytometry. (B) Shows increased resolution (reduced coefficients of variation [CVs]) for 405 nm (black bars) compared with 488 nm (white bars) SSC for the beads (X axis) shown in (a). Data are depicted as mean CV ± SD, n = 4 with * representing differences between 405 and 488 nm wavelength detection of identical samples of beads with p < 0.05 as detected by two-tailed paired t-test.
