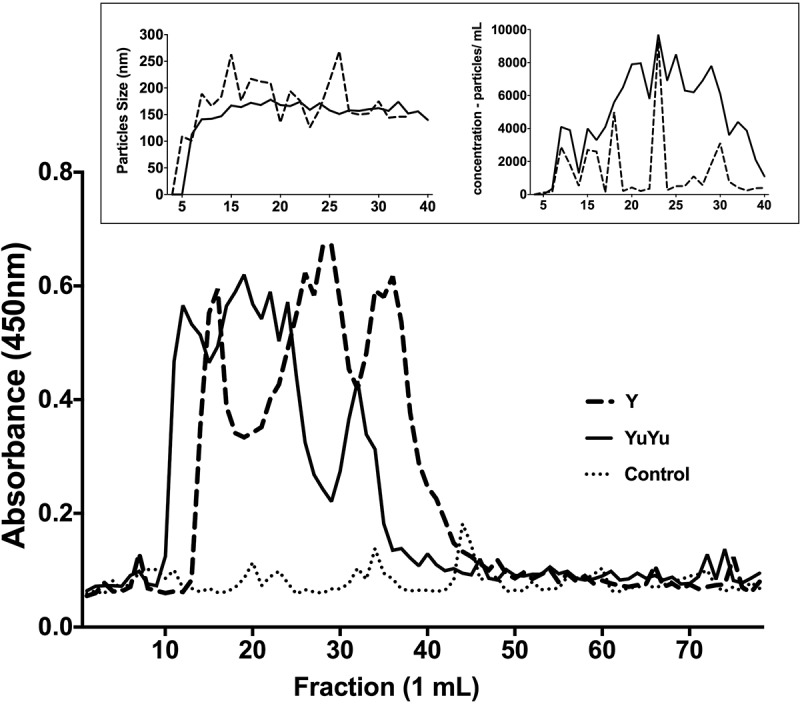
Figure 3.

Sepharose 4B elution profile of EVs released by T. cruzi trypomastigotes. Total shed vesicles obtained from trypomastigotes (Y, broken lines and YuYu, full line) and control (DMEM and 2% glucose, dotted line) were submitted to gel filtration chromatography using Sepharose CL-4B column and 1 mL fractions were collected. (a) Reactivity of each fraction to antibody 460 was determined by ELISA, and the results are expressed by absorbance at 450 nm. (b) Size (nm) and (c) concentration (particles/mL) of EVs from each fraction as determined by NTA analysis. This figure represents a typical analysis of at least three independent experiments.
