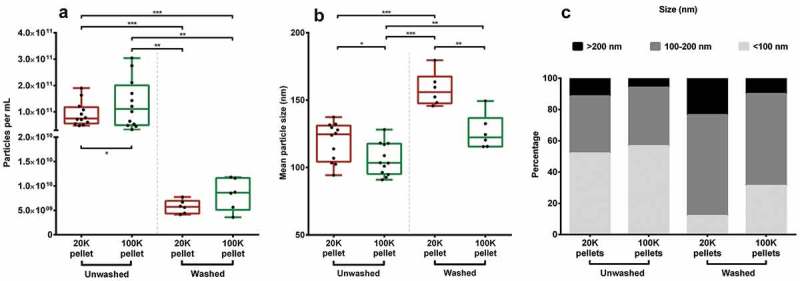
Figure 1.

NTA performed on pellets. (A) Concentration of particles and (B) size determination of particles in each pellet group. *P < 0.05. **P < 0.01. ***P < 0.001. (C) Size distribution of the different pellets divided into three fractions, i.e. <100 nm, 100–200 nm, and >200 nm. EV suspensions were diluted to obtain a particle count per frame within the recommended limits. Capture duration was 5 × 30 s at camera level 10 and the videos were analysed at detection threshold 2 with 9 × 9 blur.
