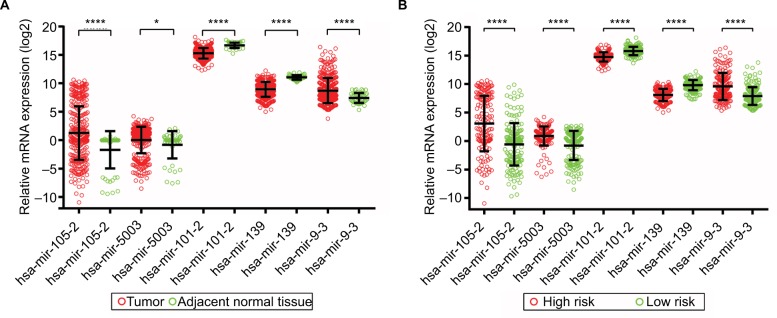
Figure 6.
Expression level of five prognostic DEMs in tumor tissue and adjacent normal liver tissue, low- and high-risk groups, respectively.
Notes: (A) Scatter plot of five prognostic DEMs’ expression level between HCC tumor tissue and adjacent normal liver tissue. (B) Scatter plot of five prognostic DEMs’ expression level between low- and high-risk groups; *P<0.05; ****P<0.0001.
Abbreviations: DEMs, differentially expressed microRNAs; HCC, hepatocellular carcinoma.

