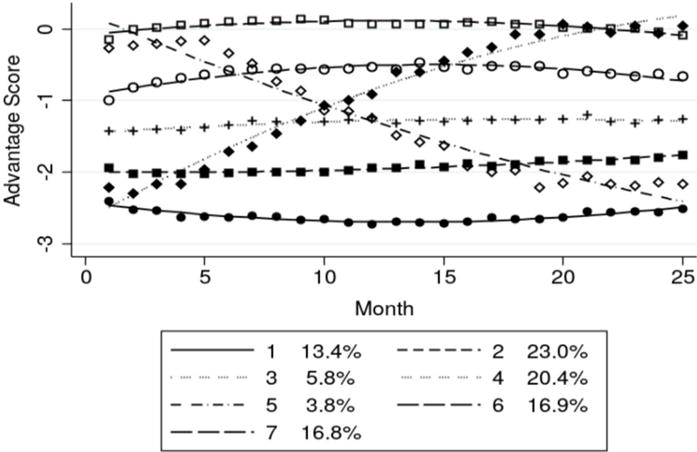
Figure 2.

Neighborhood Advantage Score Trajectories over 24 months: Blacks
1th Group: “Downward mobility” (3.8%)
2th Group: “Stay in least disadvantaged neighborhood” (16.8%)
3th Group: “Stay in less disadvantaged neighborhood” (16.9%)
4th Group: “Stay in disadvantaged neighborhood” (20.4%)
5rd Group: “Upward mobility” (5.8%)
6nd Group: “Stay in more disadvantaged neighborhood” (23.0%)
7st Group: “Stay in most disadvantaged neighborhood” (13.4%)
