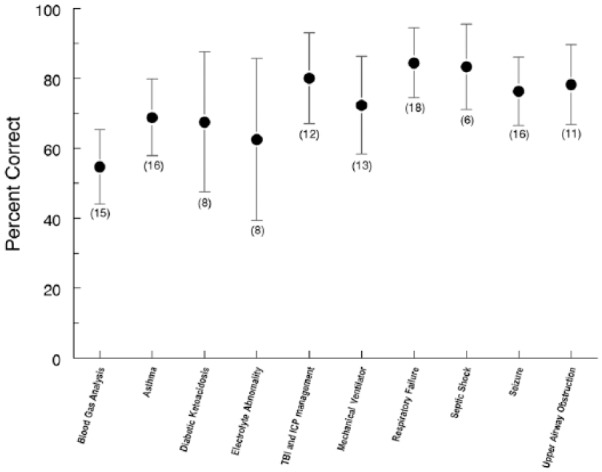
Figure 1.

Resident performance on ARS modules expressed as a percent of the number of questions answered correctly. Dark circles represent mean scores and error bars the 95% confidence interval. Numbers in parenthesis indicate the number of residents in the ARS group who participated in the quiz for that topic. Performance on blood gas analysis was less (P < .05) than that on respiratory failure. There were no differences (P > .05) among the scores for the other topics. ARS indicates audience response system; ICP, intracranial pressure; TBI, traumatic brain injury.
