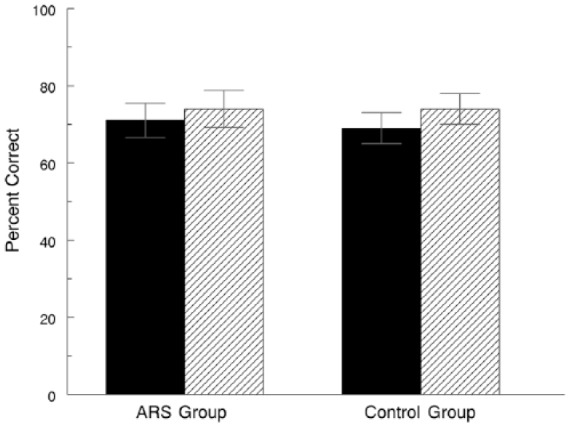
Figure 2.

Mean scores on the pre-rotation (filled bar) and post-rotation (hatched bar) examinations for the two groups. Error bars represent the 95% confidence interval. There was no difference (P > .05) between the pre and post scores for either group. ARS indicates audience response system
