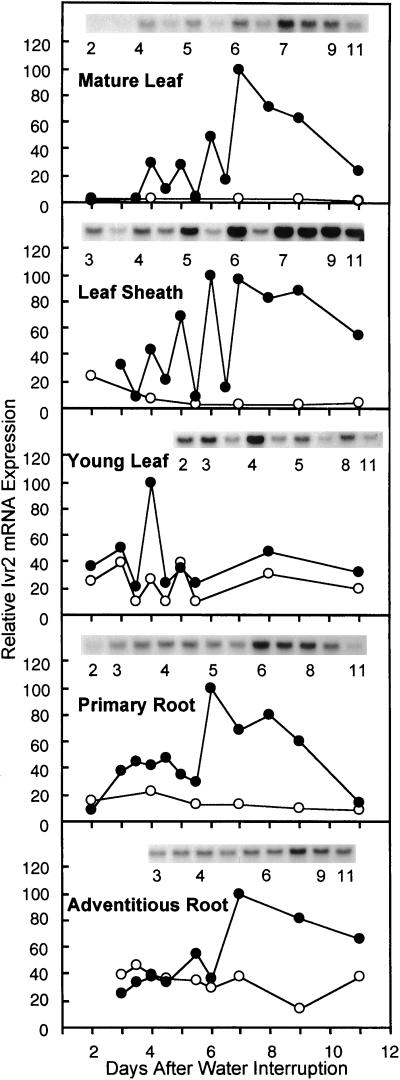
Figure 6.
Time course of Ivr2 transcript accumulation in water-stressed (black symbols) and watered plants (white symbols) in five vegetative organs. Total RNA samples (20 μg/lane) extracted from organs were hybridized with an Ivr2 cDNA probe, radioactivity was stripped, and the membrane was rehybridized with EF-α cDNA. The hybridization signal intensity was measured with an image analyzer and the relative Ivr2 mRNA expression was normalized from the average between the intensity of EF-α and of 18S rRNA staining.

