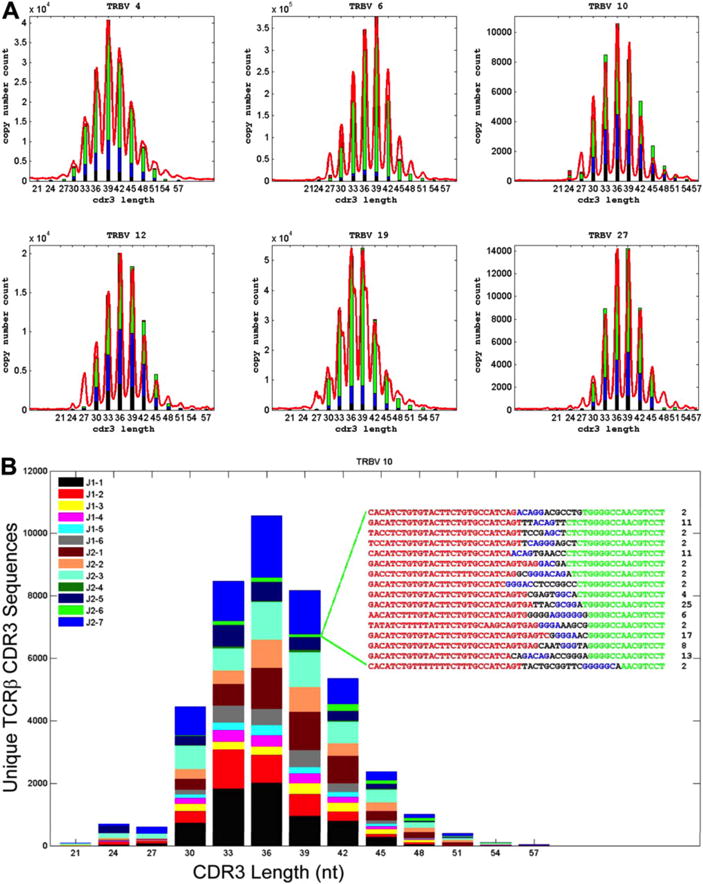
Figure 3. High-throughput TCR CDR3 sequencing captures entire T-cell diversity.

(A) Comparison of standard TCRβ spectratype data and calculated TCRβ CDR3 length distributions for sequences using representative TCR Vβ gene segments. CDR3 length is plotted along the x-axis and the number of unique CDR3 sequences with that length or the relative intensity of the corresponding peak in the spectratype is plotted along the y-axis. The length of the differently colored segments within each bar of the histograms indicates the fraction of unique CDR3 sequences that were observed 1 to 5 times (black), 6 to 10 times (blue), 11 to 100 times (green), or more than 100 times (red). (B) A representative spectratype of TCRβ CDR3 cells that use the Vβ10 gene segment. The CDR3 sequences were sorted by CDR3 length into a frequency histogram, and the sequences within each length were then color-coded on the basis of their Jβ use. The inset represents CDR3 sequences having a length of 39 nucleotides (nt), as well as the number of times that each of these sequences was observed in the data. The origin of the nucleotides in each sequence is color-coded as follows: Vβ gene segment, red; template-independent N nucleotide, black; Dβ gene segment, blue; Jβ gene segment, green. Reprinted from Robins et al. 2009.
