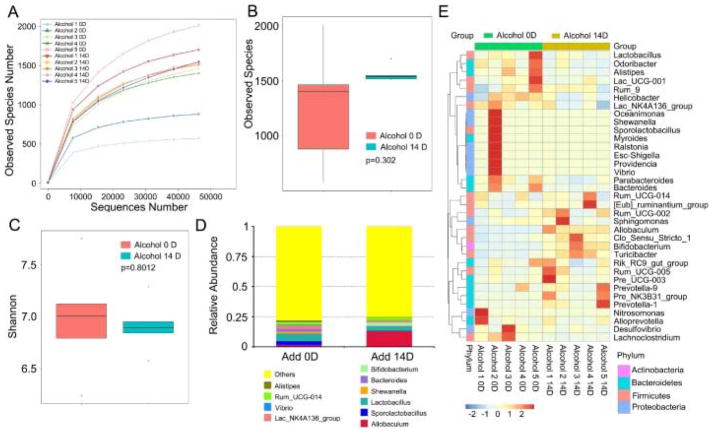
Fig. 2. Excessive alcohol consumption did not affect the abundance of enteric bacteria.
(A–C) The observed species number (A, B) and Shannon diversity index (C) of intestinal bacteria in mice before (Alcohol 0D) and after (Alcohol 14D) alcohol treatment was assessed by 16S RNAsequencing, n = 5 per group. The top and bottom boundaries of each box indicate the 75th and 25th quartile values, respectively, and lines within each box represent the 50th quartile (median) values. Ends of whiskers mark the lowest and highest diversity values in each instance. (D, E) The alteration of intestinal bacterial patterns at the genus level in mice before (Alcohol 0D) and after (Alcohol 14D) alcohol treatment were assessed using 16S high throughput sequencing, n = 5 per group. Statistically significant differences are indicated: Student’s t-test. The heatmap is colour-based on row Z-scores.

