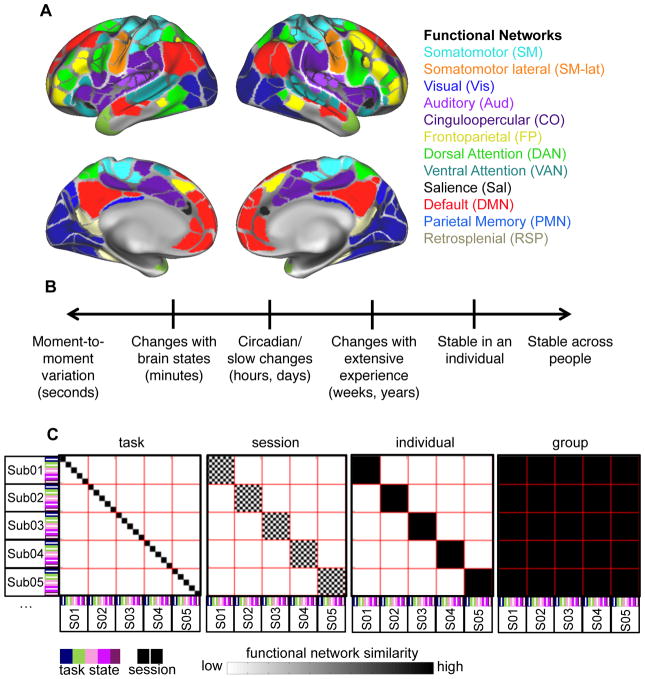
Figure 1. Scales of variability in functional brain networks.
Functional brain networks (A) may vary along different time-scales (B), ranging from complete stability (with differences only attributable to sampling variability and/or measurement noise), to varying from moment-to-moment with ongoing thoughts and processes. Intermediate to these two levels, functional networks may vary on the order of minutes depending on brain state (arousal, task engagement), more slowly over the course of the day (e.g., with circadian rhythms), over the course of weeks or years (e.g., with extensive experience in a task), or may vary across individuals. (C) If functional brain networks are stable across people (“group”, illustrated in the schematic to the right), high similarity would be expected among all measurements, even when taken from different individuals, sessions, and tasks, leading to high similarity throughout the matrix. If networks are dominated by individual-variability, high similarity would be expected of networks from the same individual (squares along the diagonal), with low similarity among networks from different individuals (middle right). Alternatively, networks that vary substantially across sessions or task-states would show similarity limited to the same session (middle left) or task (left). These different sources of variability inform our understanding of the neurobiological underpinnings of functional brain networks and how they can be used to address psychological and neuropsychiatric questions concerning brain function. See also Supp. Fig. 1A.

