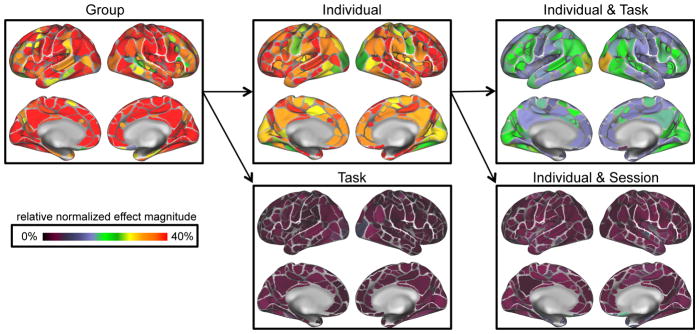
Figure 5. Individual, task, and session effects across brain regions.
The extent to which functional correlations for individual parcels are influenced by each effect (group, individual, task, individual & task, individual & session) is examined by plotting the relative normalized effect magnitudes for each parcel (see Figure 3C). See Supp. Fig 3C for task and session effects on a narrower color scale. Individual, task, and session effects differed in distribution, suggesting the presence of differing underlying mechanisms.

