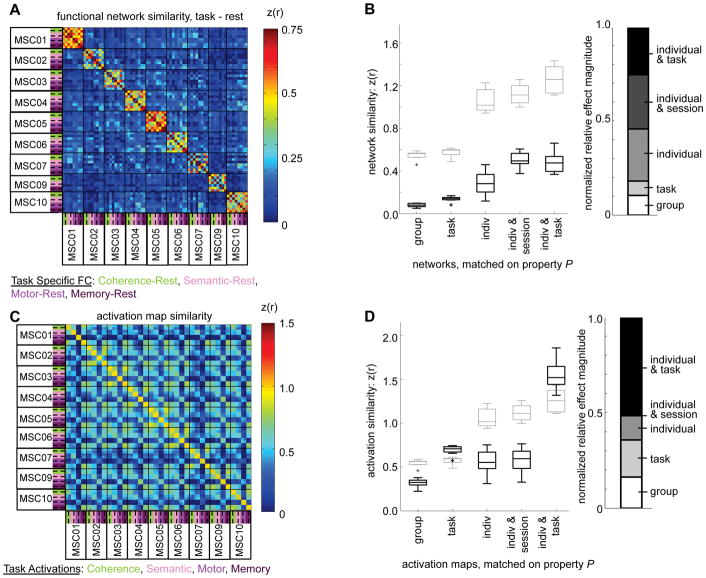
Figure 7. Relationship of variability to intrinsic and task-evoked factors.
(A) The similarity among functional networks during tasks is depicted, after subtracting resting intrinsic structure from each functional network matrix. Notably, similarity values are reduced, but block structure (i.e., individual-specific effects) remains along the diagonal. Mini-blocks along the diagonal (indicating individual-specific task effects), and off-diagonal lines (indicating session effects) are now more clearly evident. (B) The similarity for networks matched on different factors (black box plots). As suggested by panel A, network similarity was strongly reduced relative to the original networks (light gray box plots, Figure 3 - for comparison, light-gray bars were calculated without the rest condition). However, individual & session, individual & task, and cross-subject task effects remain, and are enhanced in relative magnitude (right). See Supp. Fig. 6A–C for additional comparisons of functional networks after subtracting rest. (C) Similarity of task activation maps across individuals, sessions, and tasks. Note that unlike A and Figure 3, there is reduced block structure along the diagonal, primarily dominated by mini-blocks indicating a high similarity of task-specific activation-maps within an individual. The motor task is most different from others in its activation pattern. (D) Quantification of the similarity of activation maps across different factors (black). Unlike the similarity of the original functional networks (light gray, again without rest for comparison), task- and individual & task effects are larger, with only moderate individual and group effects. See Supp. Fig. 6D–F for additional comparisons and modeling analyses.

