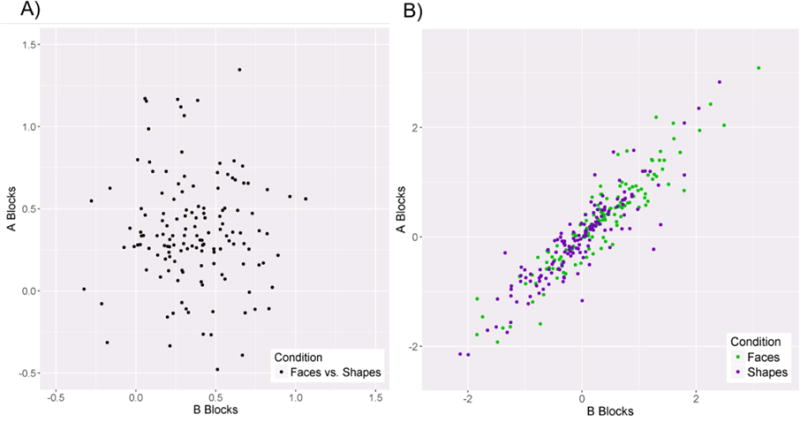
Figure 2.

a) Scatter plot depicting the relationship between A and B blocks for the faces vs. shapes contrast. b) Scatter plot depicting the relationship between the A and B blocks for the faces vs. implicit baseline and shapes vs. implicit baseline contrasts.
