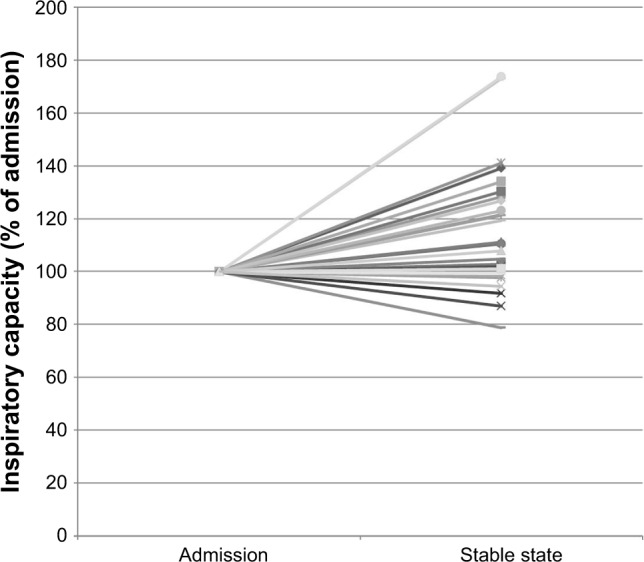
Figure 2.

The relative changes in the inspiratory capacity of each individual participant.
Note: Y axis: percentage of inspiratory capacity change for each individual within this study.

The relative changes in the inspiratory capacity of each individual participant.
Note: Y axis: percentage of inspiratory capacity change for each individual within this study.