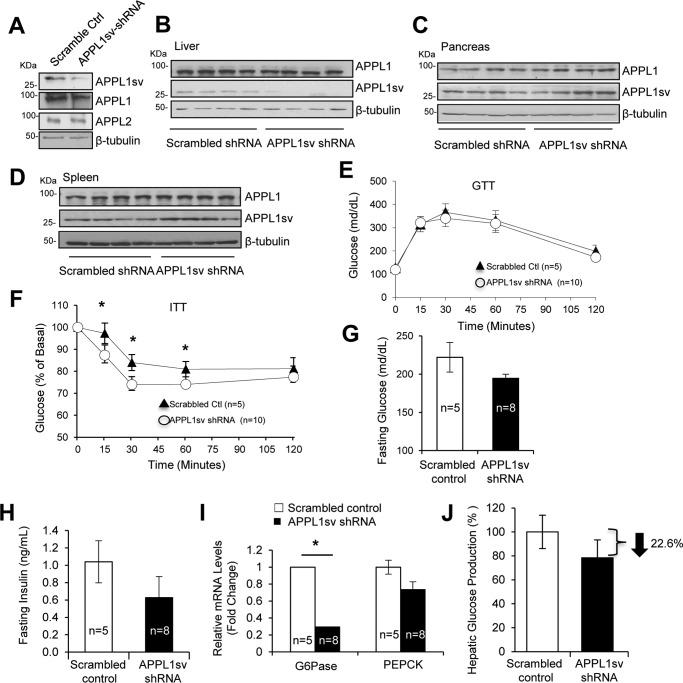
Figure 2.
The roles of APPL1sv in regulating hepatic glucose metabolism and insulin sensitivity. A, suppression of APPL1sv expression with shRNA in primary hepatocytes. Primary mouse hepatocytes were infected with an adenovirus containing GFP plus APPL1sv shRNA or GFP plus the scrambled control (Ctrl). B–D, injection of an adenovirus containing APPL1sv shRNA with GFP into mice selectively suppresses APPL1sv expression in liver tissue. Three-month-old male C57BL/6J mice fed a 45% high-fat diet for 15 weeks were treated with adenoviruses encoding APPL1sv-shRNA or scrambled control by tail vein injection (2 × 10⁹ pfu/mouse). Fourteen days after injection, mice were sacrificed, and tissues were collected. APPL1 C-terminal and APPL1 N-terminal antibodies were used to detect APPL1 and APPL1sv protein expression in the liver (B), pancreas (C), and spleen (D). E, glucose tolerance test (GTT). Mice were fasted for 16 h and then injected intraperitoneally with glucose (2 g/kg). Tail vein blood glucose was checked at the indicated times. F, insulin tolerance test (ITT). Mice were fasted for 5 h and injected intraperitoneally with 0.75 units/kg insulin. Tail vein blood glucose was checked at the indicated times. G, fasting glucose concentration. Tail vein blood was collected in 5-h fasted mice 10 days after viral injection. H, fasting insulin concentration. Tail vein blood was collected in 5-h–fasted mice 10 days after viral injection. I, gluconeogenic gene expression. The levels of Glc-6-Pase and PEPCK expression were detected via real-time quantitative PCR using primers for Glc-6-Pase and PEPCK and normalized against β-actin. J, primary mouse hepatocytes were infected with adenoviruses encoding either scrambled control shRNA or APPL1sv-shRNA. Forty-eight hours after infection, the cells were incubated in glucose-free DMEM for 30 min and then treated with either 1 × PBS or 10 nm insulin for another 30 min, followed by treatment with gluconeogenic substrates, 1 mm sodium l-lactate and 1 mm sodium pyruvate, for 6 h. Glucose production was assessed using the Amplex Red glucose/glucose oxidase assay kit. Results were analyzed by Student's t test, and error bars are presented as ± S.E. from three independent experiments. Statistical analysis in E and F was performed by two-way ANOVA with repeated measures. Statistical analysis in G–I was performed by Student's t test. Results are presented as ± S.E. *, p < 0.05.

