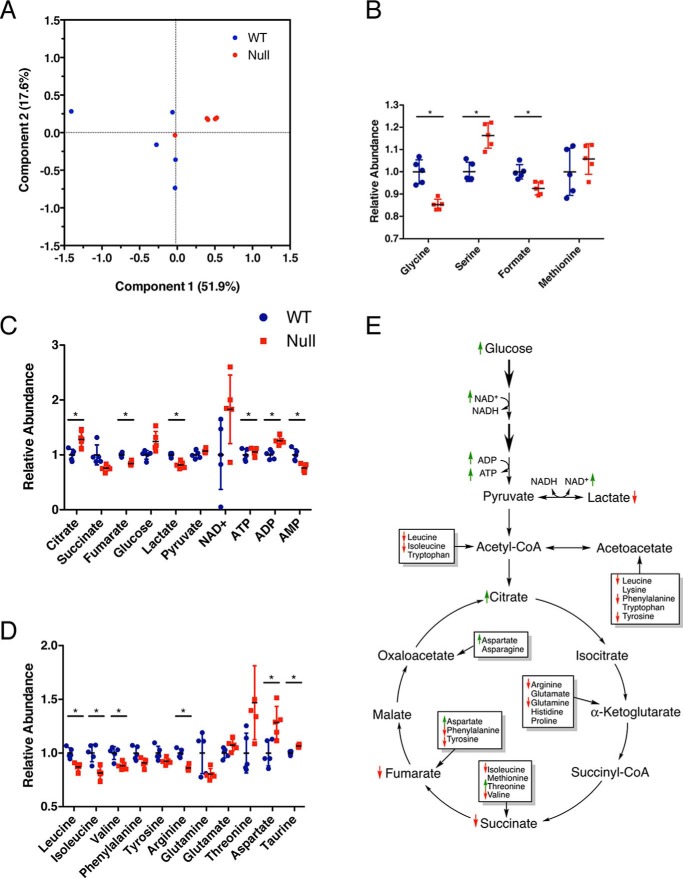
Figure 3.
Metabolomic analysis of Mthfd1l−/− embryos from unsupplemented dams. A, principal component analysis of embryo metabolites. A–D, abundance of metabolites related to (B) one-carbon metabolism, (C) energy metabolism, and (D) amino acid metabolism in Mthfd1l−/− embryos relative to Mthfd1l+/+ embryos. Data (n = 5) are shown with mean ± S.D. *, indicates false discovery rate, q < 0.05. E, diagram of metabolites detected from glycolysis and TCA cycle. Thicker arrows represent multiple enzymatic steps. Not all intermediates are shown. Small up arrows (green) and down arrows (red) represent metabolites that are increased or decreased in Mthfd1l−/− embryos compared with wildtype embryos, although not all of these reached statistical significance after false discovery rate correction. Boxes represent amino acids that feed into the TCA cycle through the anaplerotic reactions.

