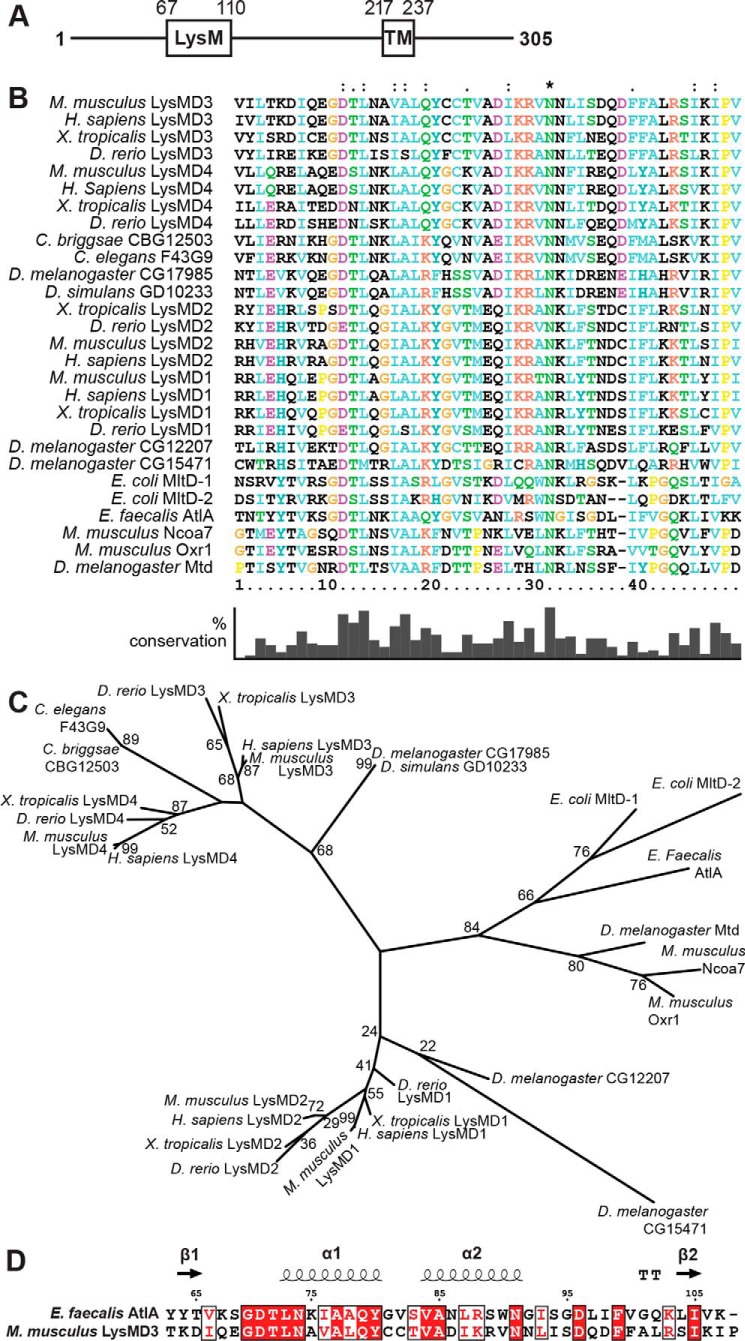
Figure 1.
Phylogenetic analysis of LysMs. A, schematic of predicted domains of mouse LysMD3. TM, transmembrane. B, multiple sequence alignment of LysMs from the indicated organisms. Positions with a single, fully conserved residue are marked with an asterisk. Positions with conservation of residues with strongly similar properties (>0.5 in the Gonnet PAM 250 matrix) or weakly similar properties (≤0.5 in the Gonnet PAM 250 matrix) are marked with a “:” or “.”, respectively. Percent conservation of residues is indicated at the bottom. C, phylogenetic tree of LysMs based on the multiple sequence alignment in B. Where known, common protein names are listed. For E. coli protein MltD, two LysMs in the protein were evaluated (MltD-1 and MltD-2). D, sequence alignment of mLysMD3 and E. faecalis AltA. Secondary structural elements from E. faecalis AltA (PDB 2KMX) are indicated at the top. T, hydrogen-bonded turn. The figure was prepared using Espript3.

