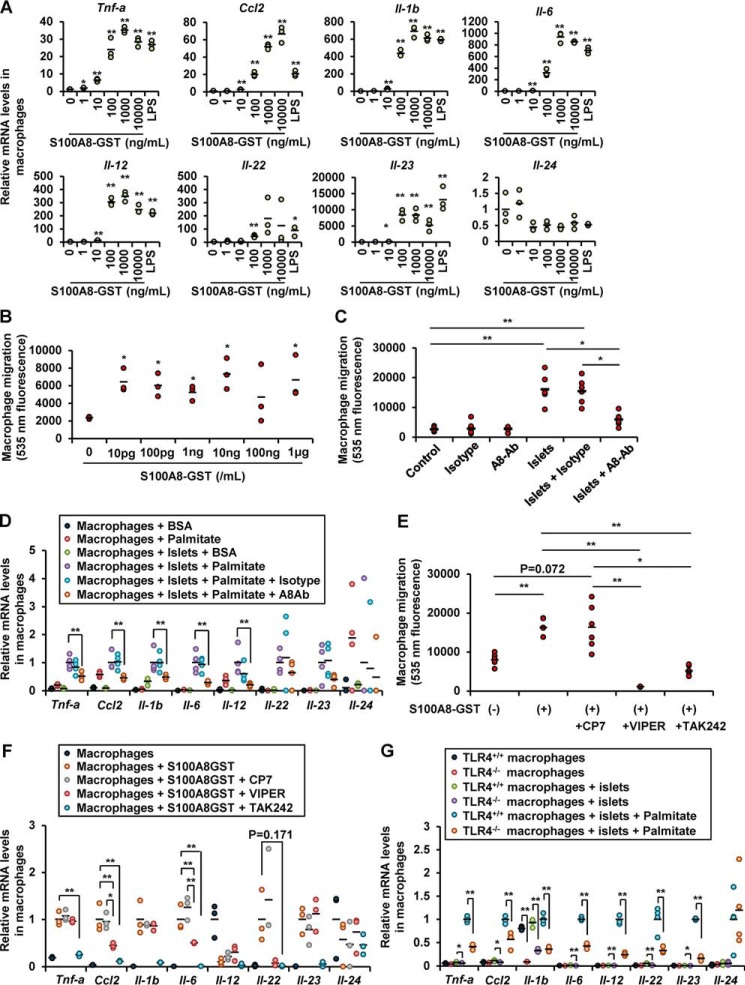
Figure 7.
Islet-derived S100A8 activated macrophage migration and inflammation. A, mRNA expression levels in peritoneal macrophages (1 × 10⁵ cells) stimulated with S100A8-GST peptide for 24 h. Horizontal bars, mean values. *, p ≤ 0.05; **, p ≤ 0.01 versus 0 ng/ml control (n = 3). B, fluorescence intensity of Calcein-AM–labeled macrophages migrating in response to S100A8-GST peptide stimulation for 24 h. Horizontal bars, mean values. *, p ≤ 0.05 versus 0 ng/ml control (n = 3). C, fluorescence intensity of migrated Calcein-AM–labeled macrophages migrating in response to co-culture with islets in the presence of anti-S100A8 neutralizing antibody (10 μg/ml) or IgG2B isotype control for 48 h. Horizontal bars, mean values. *, p ≤ 0.05; **, p ≤ 0.01 (n = 6). D, mRNA expression levels in macrophages co-cultured with the islets with/without palmitate in the presence of anti-S100A8 neutralizing antibody or IgG2B isotype control. Horizontal bars, mean values. **, p ≤ 0.01 (n = 4). E, fluorescence intensity of migrated Calcein-AM–labeled macrophages in response to co-culture with islets in the presence of recombinant S100A8 peptide and the TLR4-inhibitory peptide VIPER or TAK-242 (100 nmol/liter) for 24 h. Horizontal bars, mean values. *, p ≤ 0.05; **, p ≤ 0.01 (n = 6). F, mRNA expression levels in S100A8-stimulated macrophages cultured in the presence of the TLR4 inhibitory peptide VIPER or TAK-242 for 24 h. Horizontal bars, mean values. *, p ≤ 0.05; **, p ≤ 0.01 (n = 3). G, mRNA expression levels in TLR4+/+ or TLR4−/− macrophages co-cultured with TLR4+/+ islets in the presence of palmitate for 24 h. Horizontal bars, mean values. *, p ≤ 0.05; **, p ≤ 0.01 (n = 4).

