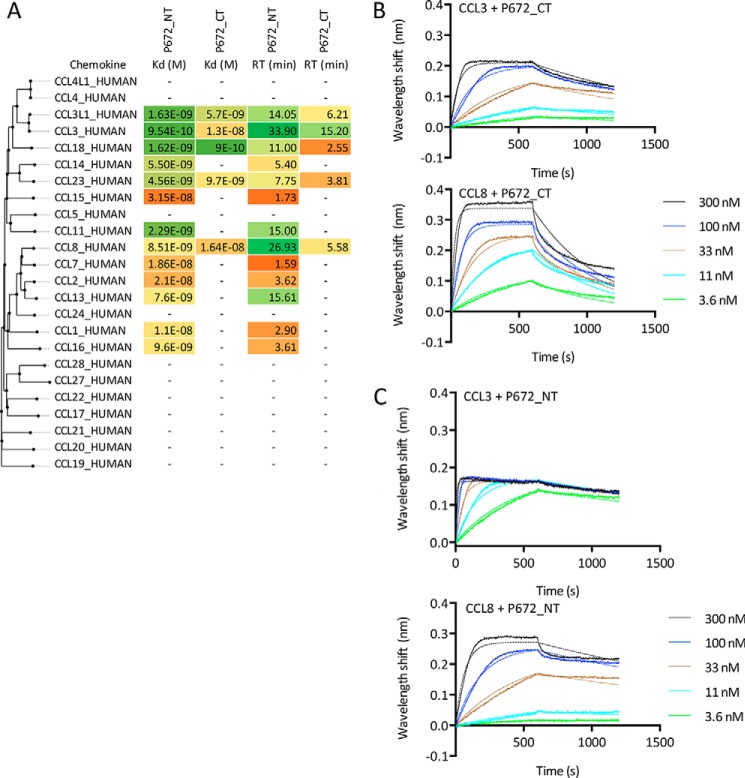
Figure 4.
Characterization of P672 binding to chemokines using biolayer interferometry. A, binding affinities (Kd, m) and target residence times (RT, minutes) of immobilized P672 (either N- or C-terminally tagged as indicated) to human CC-chemokines using biolayer interferometry. High-affinity binding and longer residence times are indicated as shades of green, medium affinity as yellow, and low affinity as shades of orange. Chemokines are arranged by sequence similarity–based phylogeny. A dash (—) indicates that binding was not detected at 300 nm chemokine concentration. B, biolayer interferometry sensorgrams showing C-terminally tagged P672 binding to different doses of chemokines CCL3 (top panel) and CCL8 (bottom panel). Plots display wavelength shift (y axis, nm) versus time (x axis, seconds). Solid lines indicate collected data, and dashed lines indicate fitted data. C, biolayer interferometry sensorgrams showing N-terminally tagged P672 binding to different doses of chemokines CCL3 (top panel) and CCL8 (bottom panel). Plots display wavelength shift (y axis, nm) versus time (x axis, seconds). Solid lines indicate collected data, and dashed lines indicate fitted data.

