Figure 5.

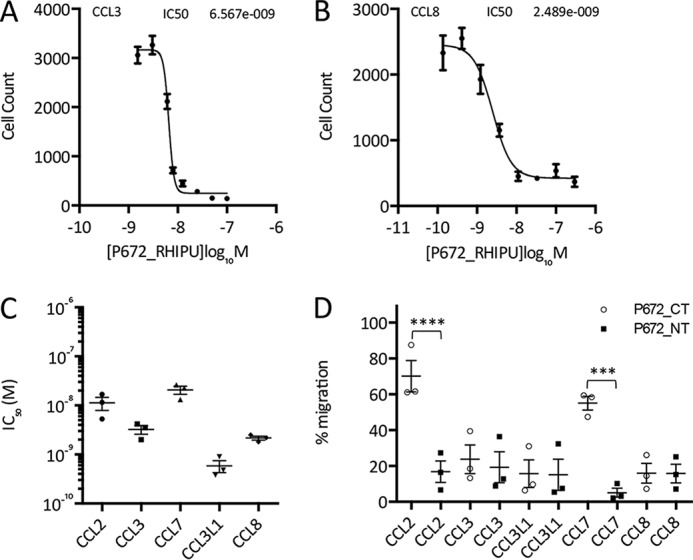
Functional neutralization of chemokine activity by P672. A and B, neutralization of CCL3 (A)- and CCL8 (B)-induced THP-1 cell migration by N-terminally tagged P672. The y axis shows cell count of THP-1 cells migrating through to the bottom chamber in response to an EC80 dose of the indicated chemokines. Data (three technical replicates) are shown as mean ± S.E. The x axis shows P672 concentration (log10 molar). The IC50 indicated was estimated by fitting an agonist response curve with four parameters as described (14). C, summary of N-terminally tagged P672 IC50 data (M, mean ± S.E. of three biological replicates analyzed as above) for chemokines that induce THP-1 cell migration. The EC80 doses of the indicated chemokines were as follows: CCL2, 0.52 nm; CCL3, 3.55 nm; CCL7, 7.18 nm; CCL3L1, 0.52 nm; and CCL8, 5.75 nm. D, percentage of migration inhibition by a fixed concentration (100 nm) of P672_CT (C-terminally tagged (open circles)) or P672_NT (N-terminally tagged (filled squares)). The experiment was performed at an EC80 concentration of the chemokines indicated. Data (three technical and three biological replicates) were normalized to chemokine-alone control to account for day to day variation. Data were analyzed with one-way analysis of variance and corrected for multiple comparisons with the Sidak method. ***, p < 0.001; ****, p < 0.0001.
