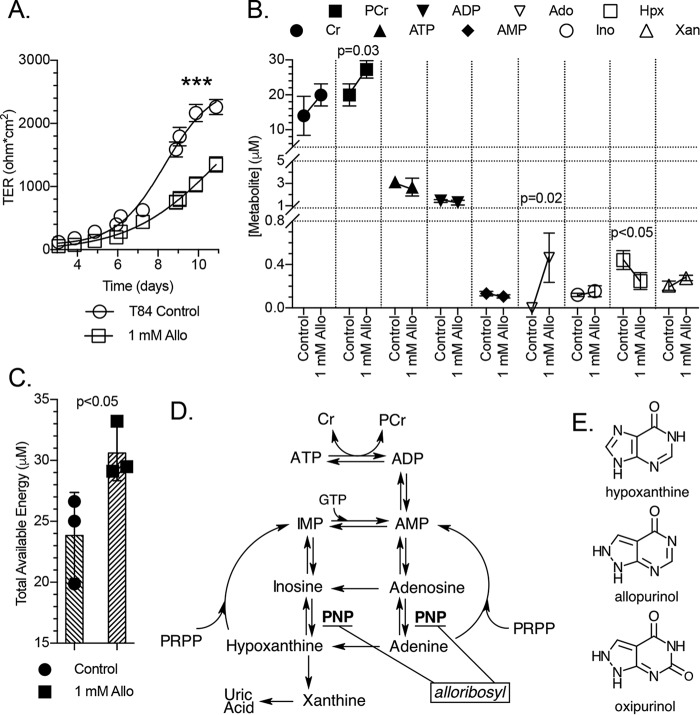
Figure 6.
Barrier development and metabolite responses to allopurinol. A, transepithelial resistance measurements of T84 cell barrier development in control and 1 mm allopurinol-treated cells; n = 6. B, metabolite responses of subconfluent T84 cells to allopurinol as measured by HPLC; n = 3, t = 20 h. C, total available energy response of experiment depicted in B. D, representation of the adenylate metabolite pathway identifying the point of hypoxanthine salvage inhibition by a putative allopurinol-ribosyl derivative (alloribosyl). E, structures of hypoxanthine, allopurinol, and oxipurinol. Data are presented as mean ± S.D. (error bars). Total available energy = PCr + ATP + (0.5 × ADP). ***, p < 0.001.

