Figure 1.
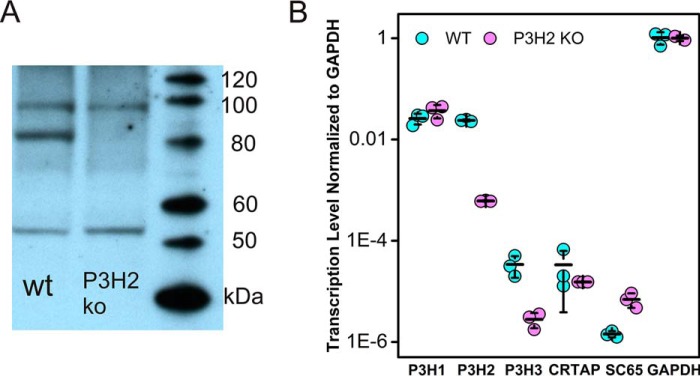
Immunoblot of P3H2 and transcription levels of P3Hs and related genes. A, chemiluminescent blot with an antibody against P3H2. P3H2 shows up as an 80-kDa band present in the WT but absent in 6A6 (P3H2 KO). B, the level of transcription of several genes related to P3Hs, and a GAPDH control transcript was examined by qRT-PCR of oligo(dT) generated first strand cDNAs of total RNA from PFHR-9 cells. Transcription levels are normalized to GAPDH transcription through absolute difference in threshold PCR cycle number and plotted logarithmically, assuming a one-cycle difference represents an exact 2-fold difference in transcription. The error bars indicate the standard deviation of cycle number.

