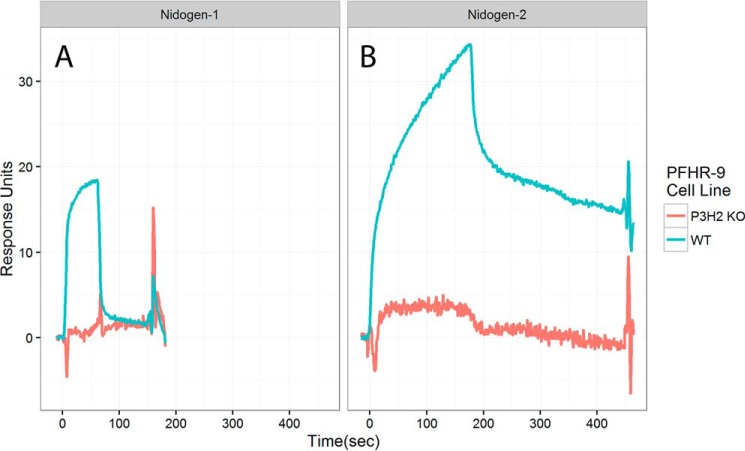
Figure 7.
Surface plasmon resonance binding of nidogens to type IV collagen from WT or P3H2 KO PFHR-9 cells. For nidogen-1 (A), the concentration was 100 μg/ml. For nidogen-2 (B), the concentration was 80 μg/ml. Each curve is an average of three injections. Response was normalized for the amount of bound type IV collagen.

