Figure 1.
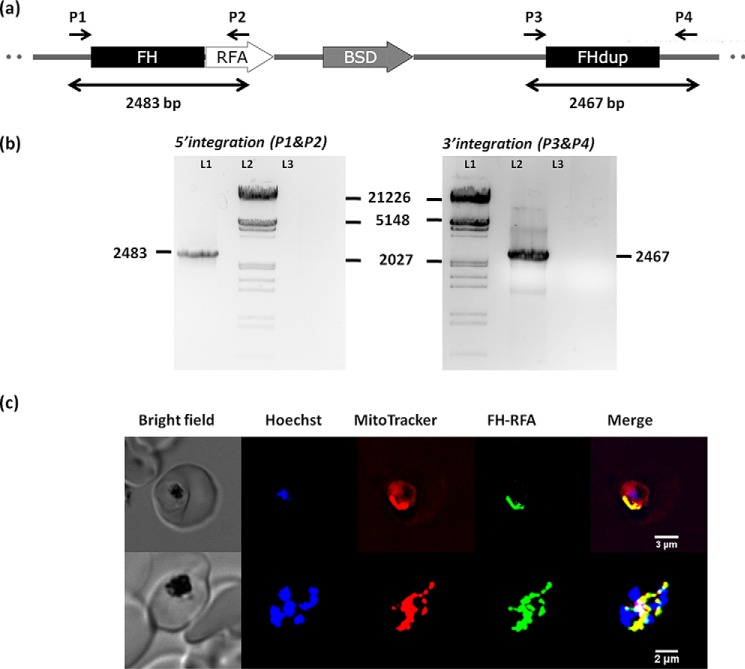
Generation of PfFH-GFP strain encoding FH-GFP and localization of PfFH. a, scheme showing the integration locus with the regulatable fluorescent affinity (RFA) (GFP + EcDHFR degradation domain + HA) tag in tandem with the fh gene in the strain PfFH-GFP. Oligonucleotides P1 and P2 and P3 and P4 were used for checking the 5′ and 3′ integration, respectively (Table S1). P1 and P4 are beyond the sites of integration in the genome. b, left panel, genotyping by PCR for validating 5′ integration. The templates used in different lanes are as follows: L1, genomic DNA from PfFH-GFP; L3, P. falciparum PM1KO genomic DNA. A band size of 2483 bp validates 5′ integration. Right panel, genotyping by PCR for validating 3′ integration. The templates used in different lanes are as follows: L2, genomic DNA from PfFH-GFP; L3, P. falciparum PM1KO genomic DNA. A band size of 2467 bp validates 3′ integration. Molecular weight markers are in lanes L2 and L1 in left and right panels, respectively. c, upper panel shows a trophozoite, and the lower panel shows a schizont. As evident from the merge, PfFH localizes to the mitochondrion. The Pearson correlation coefficients for the images are 0.8972 (upper panel) and 0.8954 (lower panel).

