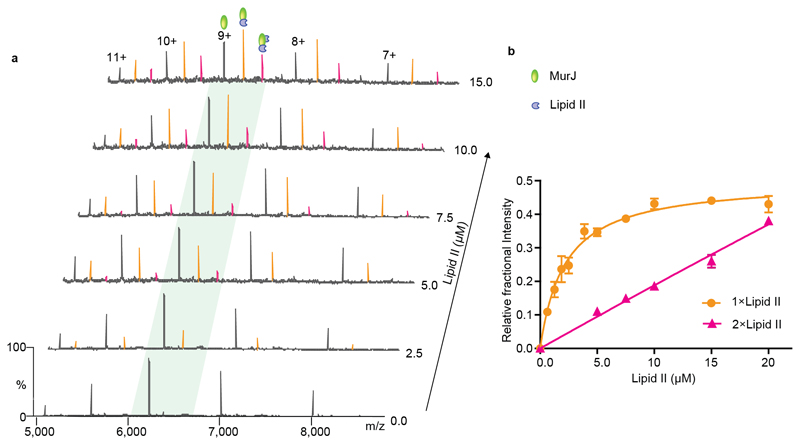
Figure 3. Determination of dissociation constants for lipid II binding to MurJ.
a Mass spectra recorded for solutions of MurJ with increasing concentrations of lipid II. At 2.5 μM lipid II a charge state series is observed (orange), corresponding to bound lipid II, which increases in intensity as the lipid II concentration is increased to 15 μM. A second lipid II binding peak (pink) emerges at concentrations above 5.0 μM. b A plot of the relative fractional intensity of the lipid binding peaks over the total peak intensity against the lipid II concentration (see Supplementary Methods) yields a curve for the first binding event and linear like fit for the second consistent with non-specific lipid II binding. Each data point and standard deviations are calculated from the average of the five observed charge states in three independent experiments. Error bars represent standard deviations (n=3).

