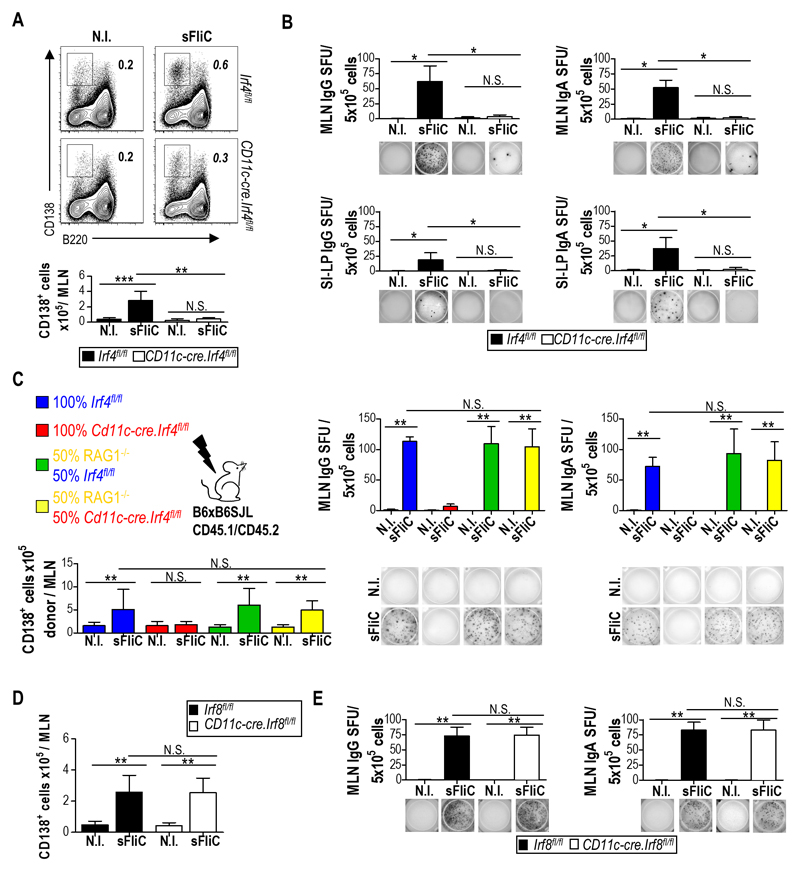
Figure 3. DP cDC control the induction of the mucosal Ab response to sFliC.
Irf4fl/fl (black) or Cd11c-cre.Irf4fl/fl (white) mice were either non-immunized (N.I) or primed and boosted with sFliC. The Ab response was evaluated 4 d post-boost. (a) Representative plots and absolute number (graphs) of plasma cells (TCRb-CD19+B220lowCD138+) in the MLN. (b) ELISPOT analysis of sFliC IgG and IgA responses in the MLN and SI-LP. Number of spot-forming units (SFU) per 5x10⁵ cells (graphs) and representative pictures of wells (lower panels). Data are mean +SD (n=4 mice/group) and are from 1 representative experiment of three performed. ***p < 0.0001, by two-way ANOVA. (c) Indicated BM chimeras were either non-immunized (N.I) or sFliC-primed boosted. Total number of CD45.2+ plasma (CD138+) cells (lower left graph), sFliC specific ASC (right upper graphs) and representative ELISPOT wells (lower right) from the MLN of chimeric mice 4 d post-boost. Data are mean +SD (n=4 mice/group). ***p < 0.0001, by one way ANOVA. (d and e) Cd11c-cre.Irf8fl/fl (white) or Irf8fl/fl control mice (black) were either non-immunized (N.I) or sFliC-primed boosted, and the absolute number of (d) plasma cells and (e) sFLiC-specific IgG and IgA ASC in the MLN assessed 4 d post boost. Data are mean +SD (n=8 mice/group) from 2 pooled experiments. ***p < 0.0001, by two way ANOVA.

