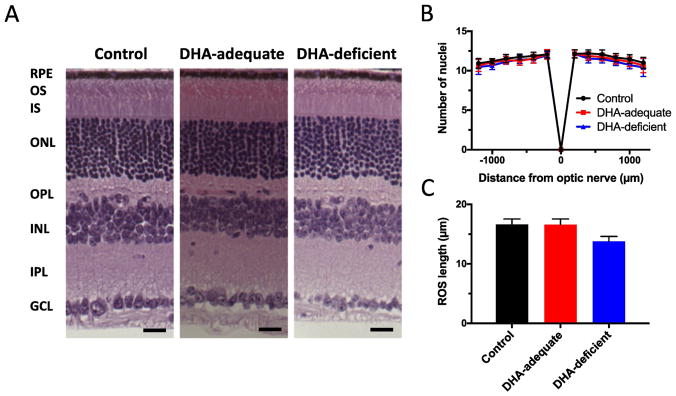
Fig. 2.
Histology of retina from control, DHA-adequate, and DHA-deficient mice. (A) Retinal sections are shown with the different layers of the retina labeled (RPE, retinal pigment epithelium; OS, outer segment, IS, inner segment, ONL, outer nuclear layer, OPL, outer plexiform layer, INL, inner nuclear layer, IPL, inner plexiform layer, GCL, ganglion cell layer). Scale bar, 25 μm. (B) The number of nuclei spanning the outer nuclear layer was determined in the superior (+) and inferior (−) regions of the retina. (C) The length of the ROS measured in retinal sections. Mean values are plotted along with the associated standard deviation. The number of mice (n) examined is 3. Statistical analyses of the data are presented in Table S7.

