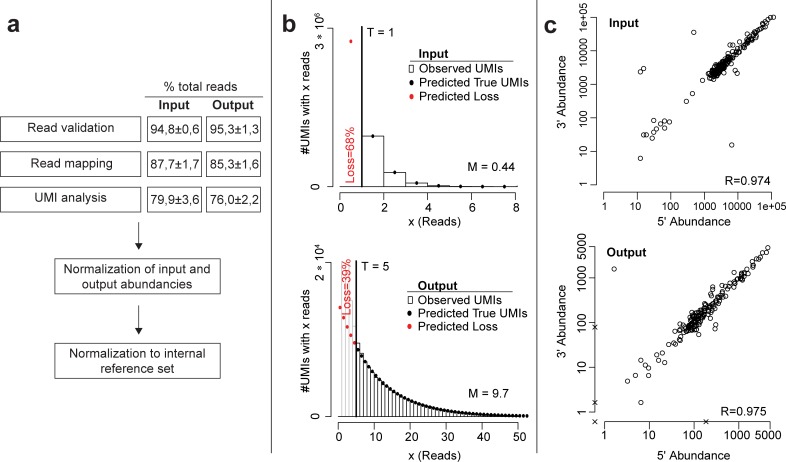
Fig 3. Quality control of iPool-Seq library.
(a) Bioinformatic workflow of iPool-Seq analysis. Input and output read percentage after validation, mapping, and UMI analysis shows the mean ± SEM of 3 biological replicates and 2 independent infections. (b) Distribution of reads per individual UMI (bars) and model prediction (dots) over all insertional mutants of 1 representative replicate for input and output. Here, the error-correction threshold was set to 1 for the input and 5 for the output. Predicted true and lost UMIs are indicated. (c) Correlation plot of UMI counts for 5′- and 3′- genomic junctions of the hpt resistance cassette. One representative replicate of input and output is depicted. Each circle represents an insertional mutant. Missing up or downstream reads are marked with x. hpt, hygromycin phosphotransferase; iPool-Seq, insertion Pool-Sequencing; M, mean number of reads per UMI in the predicted distribution; R, correlation value; T, threshold; UMI, unique molecular identifier.

