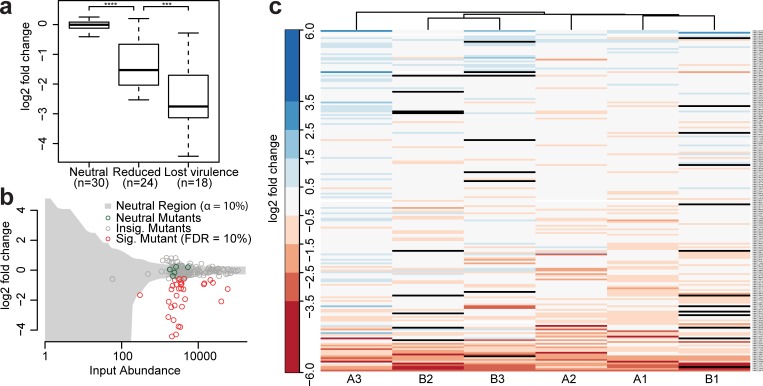
Fig 4. iPool-Seq identifies significantly depleted mutants after pooled infection.
(a) Log2-fold changes between normalized output abundances and internal reference set for mutants with known phenotypes. p-Values were calculated with Mann–Whitney U tests. p = 5e−9 for neutral versus reduced and p = 3e−4 for reduced versus lost virulence with ***p < 0.001; **** p < 0.0001 (S3 Table). (b) Log2-fold change of output over input abundances for 1 representative replicate. Each circle represents 1 insertion mutant. Internal references are marked in green, significantly depleted in red (tested against reference set using negative binomial test; S1 Data; S1 Supporting methods), unaffected mutants in gray; Insig. area is also highlighted in gray. (c) Heatmap of log2-fold changes of input normalized UMI counts of all insertional mutants sorted by mean level of abundance. Infection A and B are two independent experiments and 1, 2, and 3 are three biological replicates, which were clustered according to similarity. Mutants without detectable reads in output libraries are displayed in black (S1 Data; S1 Supporting methods). FDR, false discovery rate; Insig., insignificant; iPool-Seq, insertion Pool-Sequencing; Sig., significant; UMI, unique molecular identifier.

